


Your Tuesday lunch spot pulls $1,200. Your Thursday spot barely breaks $400. Yet you keep showing up to both because that's just... the schedule. Meanwhile, a construction site three blocks from your commissary has 200 workers ordering lunch from a competitor who drives 8 miles to get there.
This disconnect between where food trucks park and where money actually exists kills more mobile food businesses than bad food ever will. Operators burn through $300 in gas chasing $500 in sales, then wonder why margins stay razor-thin despite packed lunch rushes at their good spots.
The fix isn't complicated, but it requires discipline most operators lack: tracking real numbers at every stop, then using those numbers to build routes that maximize revenue per mile driven. Not gut feelings about which spots "seem busy." Not keeping Thursday's spot because you've always done Thursday there. Actual data driving actual decisions.
Why food trucks keep terrible routes for years
Mobile food operators inherit bad routing habits from whoever taught them the business. Someone shows you the "good spots" when you start. You add a few discoveries of your own. Maybe drop one that never works. Then you lock into that pattern and run it forever, bleeding money on dead stops while missing opportunities blocks away.
The operational inertia makes sense when you think about everything else demanding attention. Generator dies mid-shift. Health inspector shows up. Commissary runs out of your main protein. Analyzing route performance feels like homework when you're barely keeping the truck running.
But that inertia has a real price. A food truck averaging $800 per stop that replaces its two weakest stops (pulling maybe $350 each) with stronger locations (averaging $750) adds roughly $800 weekly to revenue. Factor in reduced drive time and fuel savings from smarter routing, and you're looking at $50,000+ annually from route optimization alone.
The businesses that break out of survival mode into actual profitability share one trait: they treat routing as a core operational system, not an afterthought. They know Wednesday's office park brings higher tickets than Friday's brewery. They know rain kills park spots but boosts covered locations. They build routes around data, not tradition.
Building your collection system: what to track at every stop
Forget fancy analytics for now. Start with a simple clipboard system that captures what actually matters for route decisions. Every stop needs five core metrics recorded consistently:
Stop losing sales to poor planning.
Grubzly helps you plan routes, track inventory, and maximize daily sales effortlessly.
- Real-time route optimization
- Inventory tracking & alerts
- Mobile sales & reporting
No credit card required
Sales by stop - Not just daily total. Break it down by location with arrival time, departure time, and total revenue. A spot that does $600 from 11am-2pm beats one doing $650 from 11am-3:30pm when you factor hourly performance.
Customer count - Raw transaction numbers tell you whether a spot has volume problems or ticket-size problems. Fifty $8 tickets means something different than twenty $20 tickets for route planning.
Dwell time - Track actual service time versus travel time. That industrial park might seem far, but if you're selling for 3 straight hours versus 90 minutes downtown with 45 minutes of parking hassles, the math changes.
Weather conditions - Simple notes: sunny, cloudy, rain, cold. Patterns emerge fast — office workers vanish in rain while covered brewery spots stay steady.
Competition present - Which other trucks showed up? A solo spot that does $800 beats a food truck pod where you pull $500 fighting four other vendors.
A basic spreadsheet on your phone beats a complex system you'll abandon after three days.
Keep the collection system dead simple at first. A basic spreadsheet on your phone beats a complex system you'll abandon after three days. One operator used a composition notebook for six months, writing five numbers after each stop. Those handwritten logs revealed her Tuesday university spot was actually losing money after factoring gas and time, while a construction site she considered "too far" would've netted $400 more weekly.
Converting raw numbers into routing intelligence
After 3-4 weeks of data collection, patterns emerge that gut instinct never catches. That downtown spot that feels successful might show steady decline week-over-week. The brewery that seems slow could be trending up 15% monthly as word spreads.
Here's how to analyze your stop data for routing decisions:
Calculate revenue per hour for each location. Divide total sales by time on-site, not including travel. This becomes your primary comparison metric. A location doing $200/hour for 2 hours beats one doing $150/hour for 3 hours, especially when you factor operator fatigue and fuel costs.
Map out travel segments between all your stops and commissary. Use actual drive times during your service windows, not Google's optimistic estimates. That 15-minute connection might be 35 minutes at noon. These segments become building blocks for route construction.
Identify correlation patterns in your data. Does Stop A's performance predict Stop B's? Some operators discover their office park and nearby brewery have inverse relationships — when offices are slow, the brewery is busy, making them natural same-day pairs.
Track conversion rates if you're capturing any pre-order or social media engagement data. A stop where 40% of customers pre-order beats one with 5% pre-orders for operational efficiency, even at similar revenue levels.
Start building stop profiles — single-page summaries of each location's performance characteristics:
| Metric | Downtown Office Plaza | University West Lot | Brewery Row |
|---|---|---|---|
| Avg Revenue/Hour | $265 | $180 | $225 |
| Setup Time | 25 min | 10 min | 15 min |
| Peak Window | 11:45am-1:15pm | 12:30pm-2:30pm | 5:30pm-8:00pm |
| Weather Sensitivity | High (dies in rain) | Medium | Low (covered) |
| Competition Days | Tues/Thurs (3 trucks) | Mon/Wed (1 truck) | Fri/Sat (4-5 trucks) |
| Customer Type | Quick office lunches | Students (lower tickets) | Families (higher tickets) |
These profiles become your building blocks for constructing profitable routes rather than convenient ones.
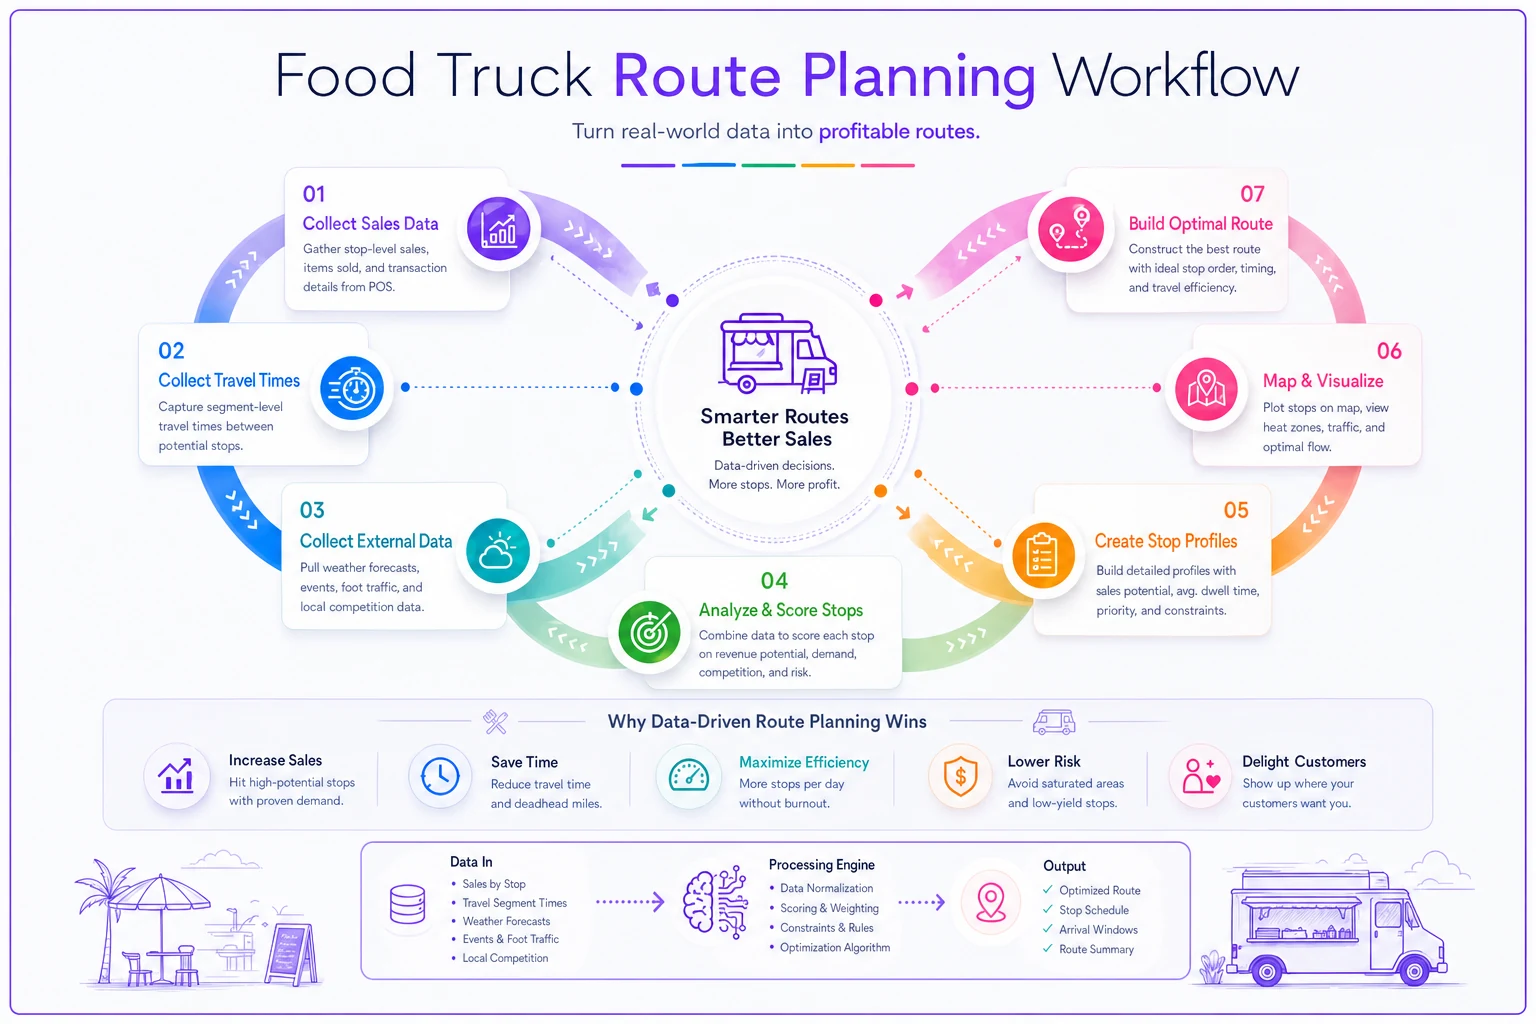
A simple visual of the steps helps teams follow the same method when analyzing stops.
The weekly routing rulebook
Most food trucks plan routes either too far in advance — locked in for months — or not at all, deciding that morning. The sweet spot is weekly planning with daily adjustment capability. Here's a framework that balances the consistency customers expect with the flexibility operations require:
Sunday: Build next week's base route
Pull last week's numbers. Identify your top 5 performing stops by revenue per hour, not total sales. These become your anchor stops — you build routes around them, not squeeze them in where convenient.
Plot drive times between anchors and identify logical connections. Can you hit the office plaza at noon then reach the brewery by 5pm? Does the university lunch crowd flow into the park's afternoon business?
Monday-Wednesday: Lock and load
These days run your proven routes. No experimentation, no special events, just consistent execution at validated stops. Your regular customers know where to find you. You know what to prep. Operations run smooth.
Tracking helps here in a specific way: you know Monday's office spot needs 80 portions of your bestseller, while Wednesday's brewery crowd wants 50 portions of shareable items.
Thursday-Friday: Test and adjust
Reserve these days for trying new spots, special events, or modified routes based on what you learned earlier in the week. That construction site someone mentioned? Thursday's when you test it. Friday food truck gathering that might cannibalize sales? Try it once with tracked metrics before committing.
Saturday-Sunday: High-value targets
Weekends follow completely different patterns. Your office parks die but parks and breweries explode. Build separate weekend routes based on weekend-specific data. Don't assume Friday evening's brewery crowd predicts Saturday afternoon's — they're often different people entirely.
One critical rule: never change more than 30% of your weekly stops at once. Customer trust takes months to build and days to destroy. They need to know where you'll be. But that doesn't mean accepting poor performance indefinitely.
When stops fail: clear rules for cutting locations
Every operator has that one stop they keep hitting despite terrible numbers. Maybe it was great two years ago. Maybe it's just convenient. But data-driven routing means knowing when to cut losses.
Set clear elimination triggers:
-
Three consecutive weeks under $150/hour
-
Weather kills sales more than 50% of scheduled days
-
Competition consistently splits an already marginal spot
-
Customer complaints about location logistics exceed 10% of transactions
When you cut a stop, inform your social media followers immediately and suggest your nearest alternative. Lost customers from a dead stop are already lost — don't compound the problem by leaving them confused.
Replace eliminated stops systematically, not randomly. Track where customer requests cluster. Monitor where competitors succeed. Watch for new developments or changing traffic patterns. That dead strip mall might become golden when the medical complex opens next door.
Seasonal adjustments and weather rules
Your January routes won't work in July. College spots die in summer. Parks that thrive in spring become ghost towns in winter. Build seasonal route variations rather than forcing year-round consistency.
Track performance by month, not just by week:
Spring patterns (March-May): Office locations strengthen as people return from remote work. Parks begin recovering. University spots peak before finals.
Summer patterns (June-August): Tourist locations activate. Office parks weaken with vacations. Evening spots extend later. Festival and event opportunities multiply.
Fall patterns (September-November): Strongest overall period for most trucks. Universities return. Offices fully staffed. Weather still reasonable. Holiday catering begins picking up.
Winter patterns (December-February): Weather becomes the primary factor. Covered locations become premium. Catering fills gaps. Daily routing gets more volatile.
Create weather-triggered route changes and decide them in advance. Don't wait until you're standing in an empty, rain-soaked park to figure out where to redirect. Have predetermined rain routes, wind routes, and extreme temperature routes based on historical performance data.
Stop-by-stop P&L analysis
Revenue tells only part of the story. A $1,000 stop might lose money while a $600 stop prints profit. Factor in real costs for each location:
-
Drive costs
Mileage from commissary, between stops on multi-stop days, and back. At $0.50-0.80 per mile for fuel and wear, that 20-mile round trip to the "good spot" costs $10-16 before you serve a single customer.
-
Time costs
Your hourly labor — or opportunity cost — plus any staff. A stop requiring 5 total hours (travel, setup, service, breakdown) at $20/hour labor costs $100 in time.
-
Location fees
Some spots charge parking, permits, or percentage fees. That farmer's market wanting 10% of sales plus a $50 booth fee changes the math quickly.
-
Spoilage risk
Longer routes mean more temperature exposure. More time means more potential waste. Track what percentage of prep typically spoils by stop.
-
Supply costs
Different locations burn through supplies differently. Office spots might go through napkins and utensils fast. Breweries might need more boats and sharing containers.
Build a simple profit calculation for each stop:
-
Revenue
-
Minus food costs (usually 30-35%)
-
Minus direct labor
-
Minus drive costs
-
Minus location fees
-
Minus attributed overhead (insurance, commissary, etc.)
-
Equals actual stop profit
You'll discover supposedly "bad" stops actually generate strong profits due to proximity and low competition, while "good" stops barely break even after true costs.
Technology amplification without dependency
Modern food trucks can use technology to sharpen routing decisions without becoming dependent on complex systems. The goal is augmenting your manual process, not replacing human judgment.
Start with basic heat mapping of your sales data. Free tools like Google My Maps let you drop pins showing revenue by location. Patterns jump out fast — a cluster of strong stops on the east side suggests a dedicated east-side day rather than zigzagging across town.
GPS tracking on your phone creates automatic logs of actual drive times and routes taken. Compare these to your estimates. Most operators underestimate transit time by 20-30%, which kills projected hourly revenues before you even arrive.
Social media polls can validate potential spots before committing truck time. "Would you buy lunch at Location X on Tuesdays?" generates real customer feedback. Just weight actual behavior over stated preferences — everyone says they'll show up.
Pre-order data becomes routing intelligence when tracked properly. Spots with high pre-order rates justify longer commits. Locations with walk-up only sales need tighter time management.
Customer relationship management doesn't require complex software. A spreadsheet tracking customer locations — work, home — reveals geographic clusters worth targeting. When 40 customers list offices in the same complex, that's a routing signal worth acting on.
Operational software platforms built for food truck operators can automate much of this collection and analysis. AI-assisted tools handle the data entry burden while operators focus on cooking and serving — tracking every transaction by location, calculating real-time profitability, and flagging route patterns based on historical performance.
But automation supplements good process, it doesn't replace it. Operators still need eyes on the street, relationships with customers, and instinct about emerging opportunities. The best results come from data-informed human decisions, not algorithmic routing alone.
Competitive intelligence without warfare
Other trucks provide valuable routing data if you pay attention without getting adversarial. Track where successful competitors cluster. Notice when they abandon spots. Learn from their experiments without copying blindly.
Build collaborative relationships where possible. Two trucks with different cuisines can share intelligence about the same stops. That taco truck might happily share that the office park prefers Tuesdays while taking Thursdays for themselves.
Monitor social media for competitor location announcements. When three established trucks suddenly abandon a Friday spot, there's probably a reason. When they cluster somewhere new, investigate what changed.
Don't assume competitor success translates to your success, though. Their customer base, price point, and operational model might support stops that would kill your business. A high-volume, low-price truck thrives where a craft-focused, premium truck starves.
Implementation timeline: from chaos to system
Don't overhaul everything at once. Here's a realistic timeline for implementing data-driven routing:
-
Week 1-2
Start basic data collection. Five metrics, every stop, no exceptions. Use paper if needed. Just start capturing.
-
Week 3-4
Continue collection while beginning simple analysis. Calculate revenue per hour for each stop. Identify your top and bottom performers.
-
Week 5-6
Build stop profiles. Map out travel segments. Start seeing patterns in good versus bad days.
-
Week 7-8
Implement first route changes. Replace your single worst stop with a test alternative. Track carefully.
-
Week 9-12
Refine and expand. Build your weekly routing rulebook. Establish weather alternatives. Create seasonal variants.
-
Ongoing
Monthly route reviews. Quarterly overhauls. Annual strategic planning based on accumulated data.
Operators who commit to this process typically see revenue increases of 15-25% within three months, mainly from eliminating dead stops and tightening drive patterns. More importantly, they build a framework for continuous improvement rather than operational stagnation.
Making it sustainable
Data-driven routing only works if you maintain the system through busy seasons, staff changes, and daily chaos. Build sustainability through simple habits and clear accountability.
Assign metrics collection to whoever handles the register. Make it part of closing procedure like counting cash. Five numbers, every stop, no matter what.
Review routes weekly even when they're working. Complacency kills margins slowly. That great spot might be declining gradually — invisible without consistent tracking.
Share routing decisions with your team. When they understand why you're abandoning the convenient Tuesday spot for the profitable but distant alternative, they'll support the extra effort instead of resenting the inconvenience.
Create forcing functions for analysis. Block Sunday mornings for route planning. Set calendar reminders for monthly reviews. Make it harder to skip than to complete.
Document everything in a way someone else could understand. When you're sick, someone needs to know why you drive to that weird industrial park on Wednesdays. When you sell the business, organized routing data adds real, demonstrable value.
The most successful food truck operators treat routing as seriously as food quality. A perfect taco served at a dead stop generates zero profit. Sustainable businesses require systematic approaches to fundamental operations — including where to park.
Your truck burns fuel whether you're heading to a $400 stop or a $1,200 stop. The drive time costs the same. Setup effort identical. The only difference is the data you use to decide which direction to turn when leaving your commissary.
Stop accepting inherited routes. Stop maintaining "traditional" stops out of habit. Start tracking, analyzing, and optimizing based on actual performance data. The gap between random routing and data-driven decisions is the gap between barely surviving and building a genuinely profitable mobile food business.
Every mile matters when your kitchen has wheels. Make sure those miles lead somewhere worth going.
Ready to drive your food truck business forward?
Join 2,000+ food truck operators relying on Grubzly to boost efficiency, increase sales, and delight customers.