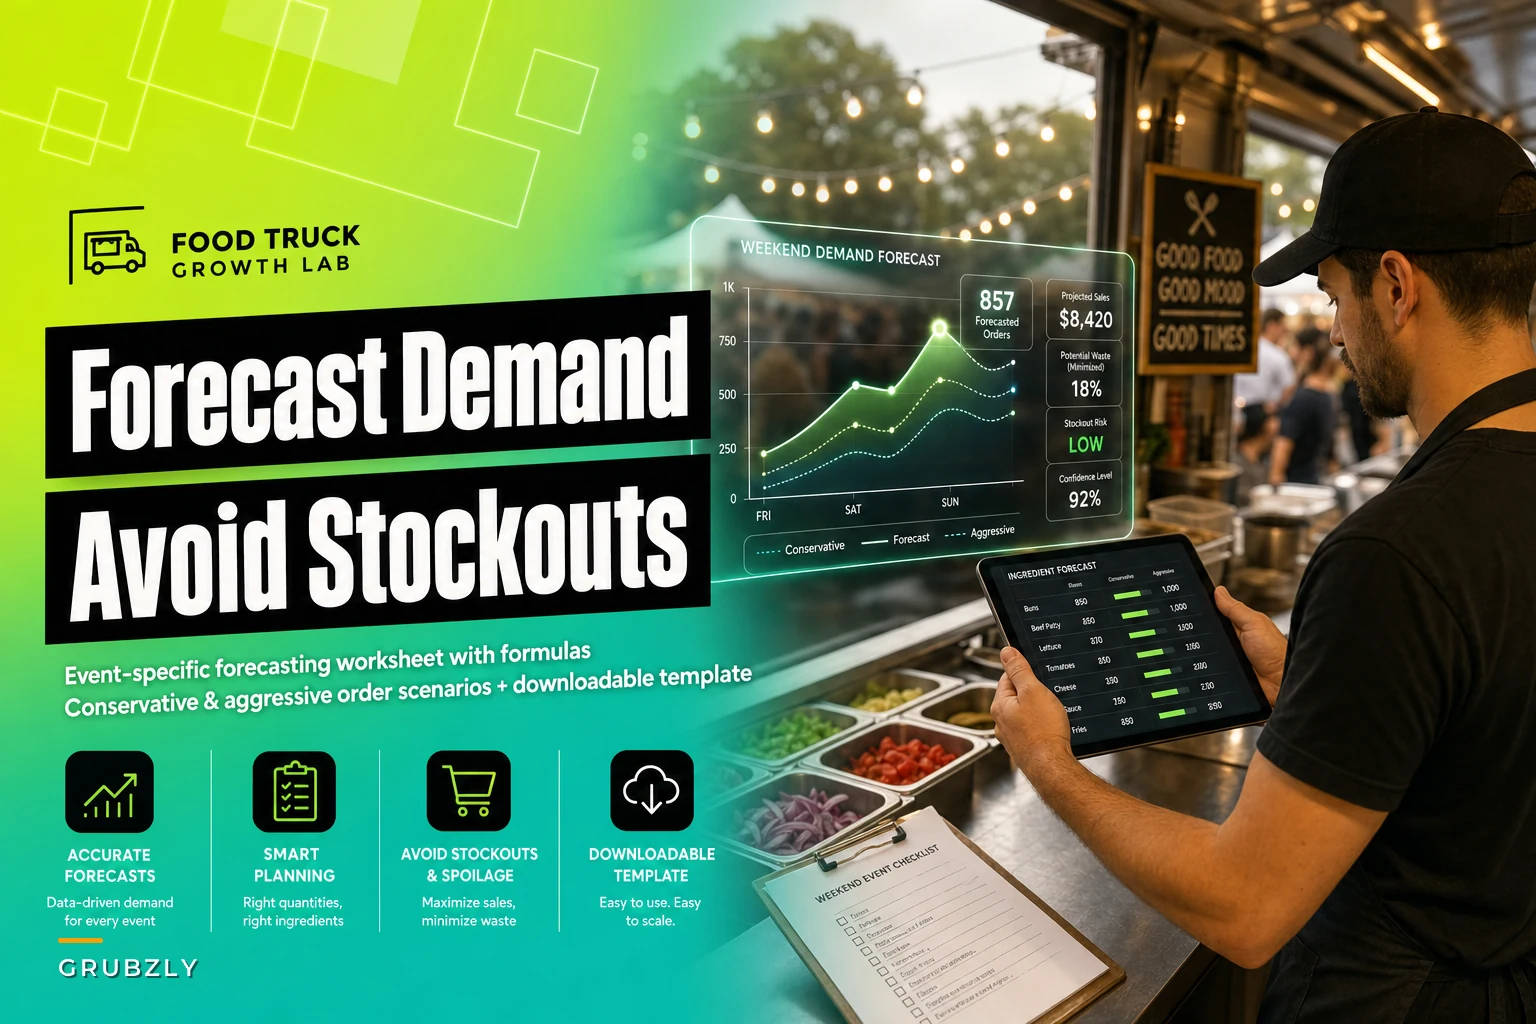

Every food truck operator knows the Friday afternoon panic. You're prepping for Saturday's music festival, staring at your supplier's order form, trying to figure out how many pounds of brisket to order. Order too much and Sunday night you're throwing away $400 worth of spoiled meat. Order too little and by 2pm Saturday you're turning away customers while your competitors keep serving.
The real problem isn't just guessing wrong. Most food trucks bounce between two extremes — either they massively over-order "just to be safe" and eat the spoilage costs, or they run lean and constantly apologize when popular items run out. Both approaches kill profitability, just in different ways.
Why standard restaurant forecasting breaks down for mobile operations
Traditional restaurant forecasting relies on consistent foot traffic patterns. Tuesday lunch pulls 80 covers, Wednesday pulls 85, you adjust for weather and holidays. Simple enough when customers come to you.
Event-based food service operates on completely different dynamics. A brewery's Saturday afternoon crowd might be 200 people one week and 600 the next, depending on whether there's live music, a competing event across town, or if the local college team is playing. Your baseline data becomes almost useless when every service day is a different combination of variables.
Food trucks also face a layer of complexity that brick-and-mortar restaurants simply don't deal with. You can't run to the walk-in cooler mid-service. When you're parked at a festival 45 minutes from your commissary kitchen, running out means you're done for the day — no emergency grocery runs, no pulling backup stock from the freezer.
The financial hit compounds fast. A taco truck working three events per weekend might waste $300-500 weekly on over-ordering during slow periods, while simultaneously losing $800-1,200 in missed sales during unexpectedly busy ones. Over a full season, those miscalculations can be the difference between profitable growth and barely breaking even.
Building your event-specific forecasting framework
The solution isn't complicated formulas or expensive software, at least not at first. You need a systematic approach that accounts for the unique variables at each event while building a reliable dataset over time.
Stop losing sales to poor planning.
Grubzly helps you plan routes, track inventory, and maximize daily sales effortlessly.
- Real-time route optimization
- Inventory tracking & alerts
- Mobile sales & reporting
No credit card required
Start with your event categories. Not all farmers markets behave the same way, and a brewery pop-up is nothing like a corporate catering gig. Create distinct categories based on actual service patterns:
High-volume festivals (music festivals, art fairs, food truck rallies) typically see 300-500 transactions across 5-6 hours. These events justify maximum prep and full menu availability.
Medium-volume regular stops (brewery rotations, farmers markets, lunch spots) usually generate 80-150 transactions. These require targeted prep focused on your most popular items.
Low-volume specialty events (private parties, corporate lots, small gatherings) might only see 30-80 transactions but often at higher ticket averages.
Within each category, track the specific factors that affect volume. For farmers markets, time of month matters more than most operators realize — the first weekend after payday typically sees 25-35% higher sales than end-of-month weekends. For brewery events, weather becomes the dominant variable, with sunny Saturdays above 72°F generating roughly double the sales of overcast days below 65°F.
The conservative/aggressive ordering model
Rather than trying to nail a perfect order quantity, successful operators work with range-based forecasting. This acknowledges the inherent uncertainty while protecting against both extremes.
Your conservative baseline is the minimum viable order — enough inventory to serve your expected floor of customers without disappointing regulars. Calculate this by taking your lowest attendance scenario from similar past events and adding a 10% buffer. For a farmers market that historically serves between 65-95 customers, your conservative order assumes 72 customers (65 × 1.1).
Your aggressive ceiling factors in the realistic maximum attendance while accounting for spoilage tolerance. Take your highest reasonable attendance expectation and multiply by 0.85 to build in waste protection. If that same farmers market could potentially serve 140 customers on a perfect day, your aggressive order targets 119 customers (140 × 0.85).
You don't order exactly at either number. You blend them based on confidence. Strong indicators suggesting higher attendance — perfect weather, no competing events, heavy social media engagement — push you toward the aggressive number. Red flags like rain probability, major local events nearby, or end-of-month timing keep you conservative.
Creating your worksheet with working formulas
Your forecasting worksheet needs to be simple enough to use Friday afternoon while you're still prepping, but detailed enough to actually improve accuracy over time.
Structure it with these core components:
Event Details Section:
-
Event type and location
-
Historical attendance range
-
Weather forecast
-
Competing events flag
-
Special circumstances
Sales Mix Predictor: Track your typical item distribution by event type. A brewery rotation might show:
-
Tacos
45% of orders
-
Nachos
25% of orders
-
Quesadillas
20% of orders
-
Sides/drinks
10% of orders
Ingredient Calculation Table:
| Menu Item | Conservative Orders | Aggressive Orders | Actual Mix % | Portions Needed | Raw Ingredient |
|---|---|---|---|---|---|
| Tacos | 72 | 119 | 45% | 32-54 | 8-13.5 lbs protein |
| Nachos | 72 | 119 | 25% | 18-30 | 4.5-7.5 lbs cheese |
| Quesadillas | 72 | 119 | 20% | 14-24 | 14-24 tortillas |
Build formulas that automatically calculate portion requirements:
-
Conservative Portions = Conservative Orders × Actual Mix %
-
Aggressive Portions = Aggressive Orders × Actual Mix %
-
Protein Needed = Portions × 4 oz per serving ÷ 16
Spoilage Buffer Calculations: Different ingredients need different buffer strategies. Proteins need tight control — 5-10% maximum buffer. Dry goods can handle 20-25% excess without much loss. Build these directly into your calculations rather than trying to eyeball it at the end.
Build spoilage buffers into ingredient formulas so you don't have to add them manually on Friday.
Use this workflow for preparing the worksheet:
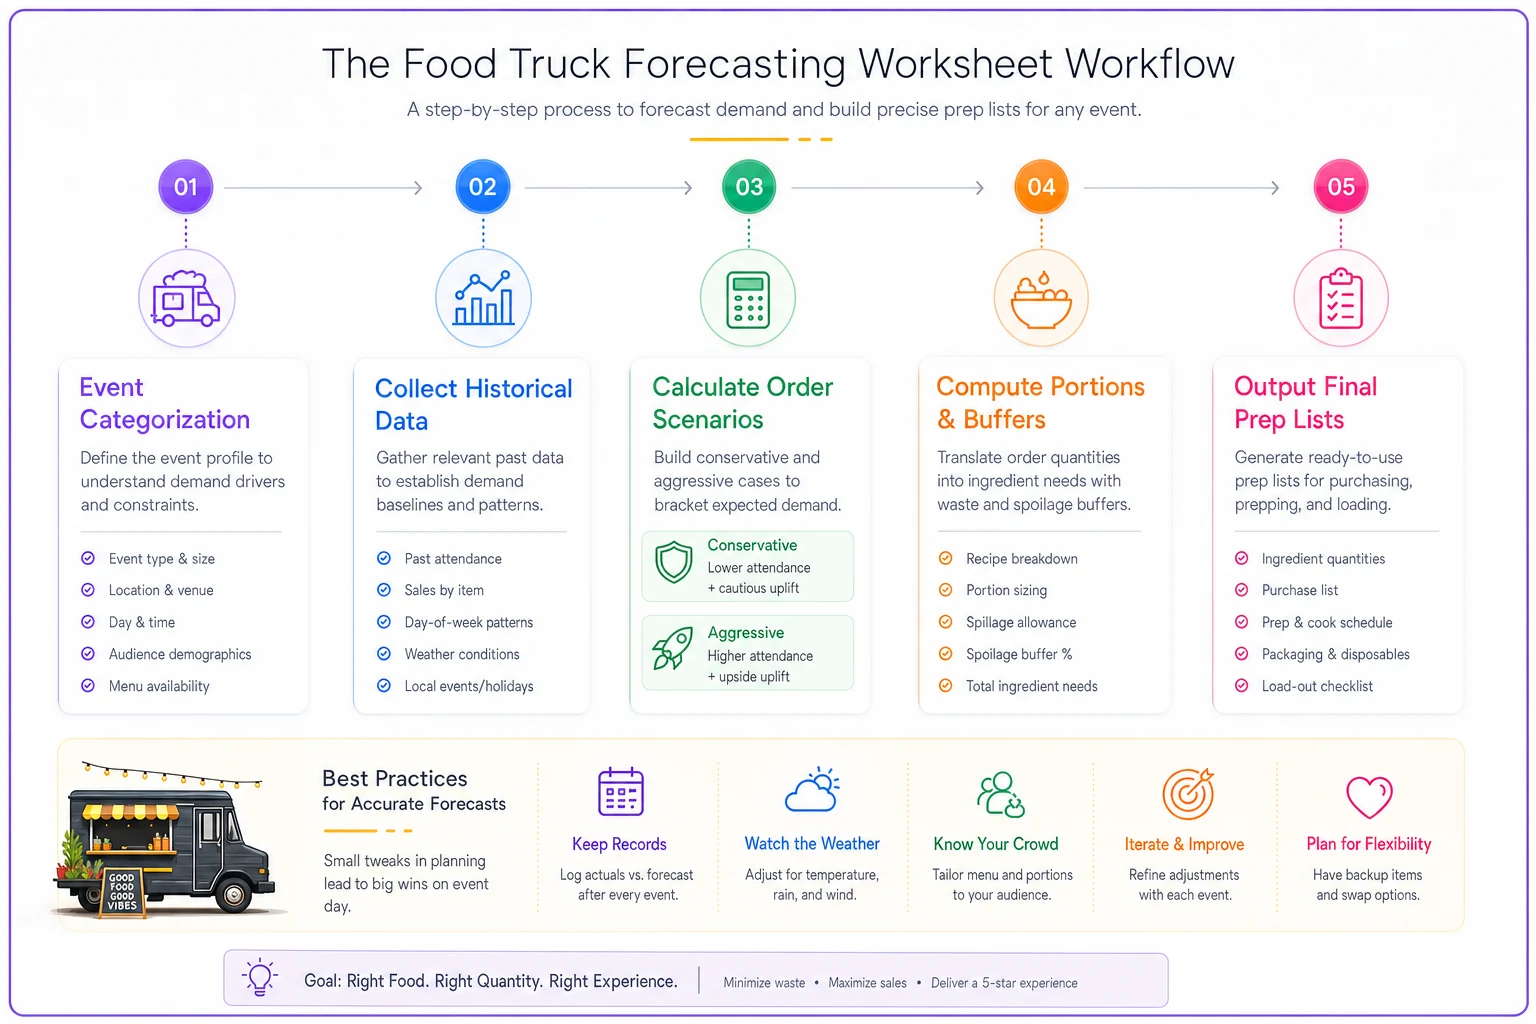
This visual maps the worksheet workflow.
Reading the confidence indicators
The forecast is only as good as your ability to read the signals. Some indicators deserve more weight than others.
Strong positive indicators:
-
Pre-event social media engagement exceeding 200% of normal
-
Clear weather forecast with temperatures between 68-78°F
-
No major competing events within 10 miles
-
Event falling on the weekend after typical paydays
-
Return to a popular venue with an established following
Warning signals for conservative ordering:
-
Rain probability above 40%
-
Temperature extremes (below 50°F or above 95°F)
-
Major sports events or concerts nearby
-
First time at a venue
-
End-of-month timing
Track these against actual performance. You'll find out pretty quickly which factors actually matter for your specific operation. A BBQ truck might thrive in 90°F heat while a soup concept sees sales crater above 80°F.
Real worksheet example: Music festival preparation
Here's an actual forecast walkthrough for a Saturday music festival. The event runs noon to 8pm with expected total attendance of 3,000 people across all vendors.
Initial Assessment:
-
12 food trucks confirmed
-
Historical capture rate at similar events
2.5-4% of total attendance
-
Weather forecast
Partly cloudy, high of 74°F, 10% rain chance
-
No major competing events
Baseline Calculations:
-
Conservative estimate
3,000 × 2.5% = 75 customers
-
Aggressive estimate
3,000 × 4% = 120 customers
-
Confidence adjustment
Strong indicators push toward 65% aggressive weighting
Final Target: (75 × 0.35) + (120 × 0.65) = 104 projected customers
Menu Mix Application (based on festival history):
-
Loaded Fries
35% = 36 orders
-
Burgers
30% = 31 orders
-
Hot Dogs
20% = 21 orders
-
Drinks/Sides
15% = 16 orders
Ingredient Orders:
-
Ground beef
31 burgers × 6 oz = 11.6 lbs → Order 13 lbs (includes buffer)
-
Potato fries
36 orders × 8 oz = 18 lbs → Order 20 lbs
-
Hot dogs
21 × 1.5 per order = 32 dogs → Order 36 (nearest package size)
-
Buns
52 needed → Order 60 (standard package count)
That process eliminates the Friday guessing game while building in reasonable protection against both stockouts and spoilage.
Post-event analysis and refinement
The worksheet only gets better if you close the feedback loop. After each event, take 10 minutes to record:
Actual Performance:
-
Total customers served
-
Items that sold out (and when)
-
Excess inventory by category
-
Unusual factors that affected sales
Variance Analysis: Compare forecast to reality, but focus on understanding why variances happened rather than just logging numbers. Did you underestimate demand because a headlining band drew younger crowds who gravitated toward different menu items? Did rain show up despite a low probability forecast? Those insights sharpen future predictions more than any formula adjustment.
Adjustment Patterns: Over time, patterns start showing up. Maybe your brewery events consistently outperform conservative estimates by around 20%, while farmers markets tend to land right at your midpoint projection. Build those venue-specific adjustments into your model rather than starting fresh each time.
Common forecasting mistakes that cost real money
The "Big Event" Overcorrection After running out of food at one profitable event, operators sometimes swing hard the other direction and order for maximum possible demand at every subsequent event. Fear-based ordering can waste thousands in spoilage over a season. Stick to your model even after a frustrating stockout.
Ignoring Day-of-Week Patterns Sunday events consistently underperform Saturday equivalents by roughly 20-30%, yet plenty of operators order identical quantities for both days. Your worksheet should include day-of-week multipliers based on actual historical data.
New Venue Optimism First-time venues rarely match established stop performance — they typically pull 40-60% of projected volumes. Always use conservative estimates for new locations until you have real data, regardless of what the event organizer tells you about expected attendance.
Menu Mix Rigidity Assuming your standard menu mix applies across all event types leads to dramatic mismatches. Festival crowds might order 60% of your premium items while office park stops lean 70% toward value options. Track mix by venue type, not just overall averages.
Making forecasting work with operational software
Manual worksheets give you a solid foundation, but they get unwieldy fast as your operation grows. When you're running 15-20 events a month across multiple venues, spreadsheets and paper notes start breaking down.
This is where AI-powered operational platforms can actually make a difference for food trucks trying to scale without losing forecast accuracy. Instead of manually checking weather data and competing events, the software pulls that information automatically. Your historical sales data feeds directly into forecast models that improve with every event you complete.
The real value is pattern recognition that's hard to catch manually. A well-built system might notice that your taco sales spike 30% when the temperature hits 76°F versus 71°F, or that the second Saturday at a farmers market consistently outperforms the fourth by 22%. Those micro-patterns compound into noticeably better predictions over time.
Modern food truck management platforms also handle the downstream implications of your forecasts. Once you confirm expected volumes, the system can generate prep lists, calculate staff hours needed, and suggest menu pricing based on projected demand. The forecast stops being just numbers on a sheet and becomes something you can actually act on.
The integration with inventory tracking closes the loop. As you serve customers, real-time depletion data refines projections for your next stop that same day. If lunch service at the office park moves 20% more burritos than expected, the system adjusts evening brewery projections accordingly.
Stop treating every event like a guess. Whether you're starting with a basic spreadsheet or exploring operational software, the key is building a systematic approach that learns from experience rather than repeating the same ordering mistakes.
Start with your next three events. Track conservative and aggressive scenarios, record actual results, and watch your accuracy improve within a few weeks. Once you have 10-15 events logged, patterns become obvious and profitable ordering becomes predictable.
The difference between food trucks that grow and ones that barely scrape by often comes down to these operational details. Every pound of protein you don't throw away and every customer you don't lose to a stockout directly impacts your bottom line. In a business where margins are already tight, accurate forecasting might be the most valuable habit you build.
The goal isn't perfect predictions — that's not realistic in event-based food service. The goal is consistent improvement and protecting yourself against the extremes that kill profitability. Build your forecast, trust your data, and stop leaving money on the table through poor inventory planning.
Ready to drive your food truck business forward?
Join 2,000+ food truck operators relying on Grubzly to boost efficiency, increase sales, and delight customers.