

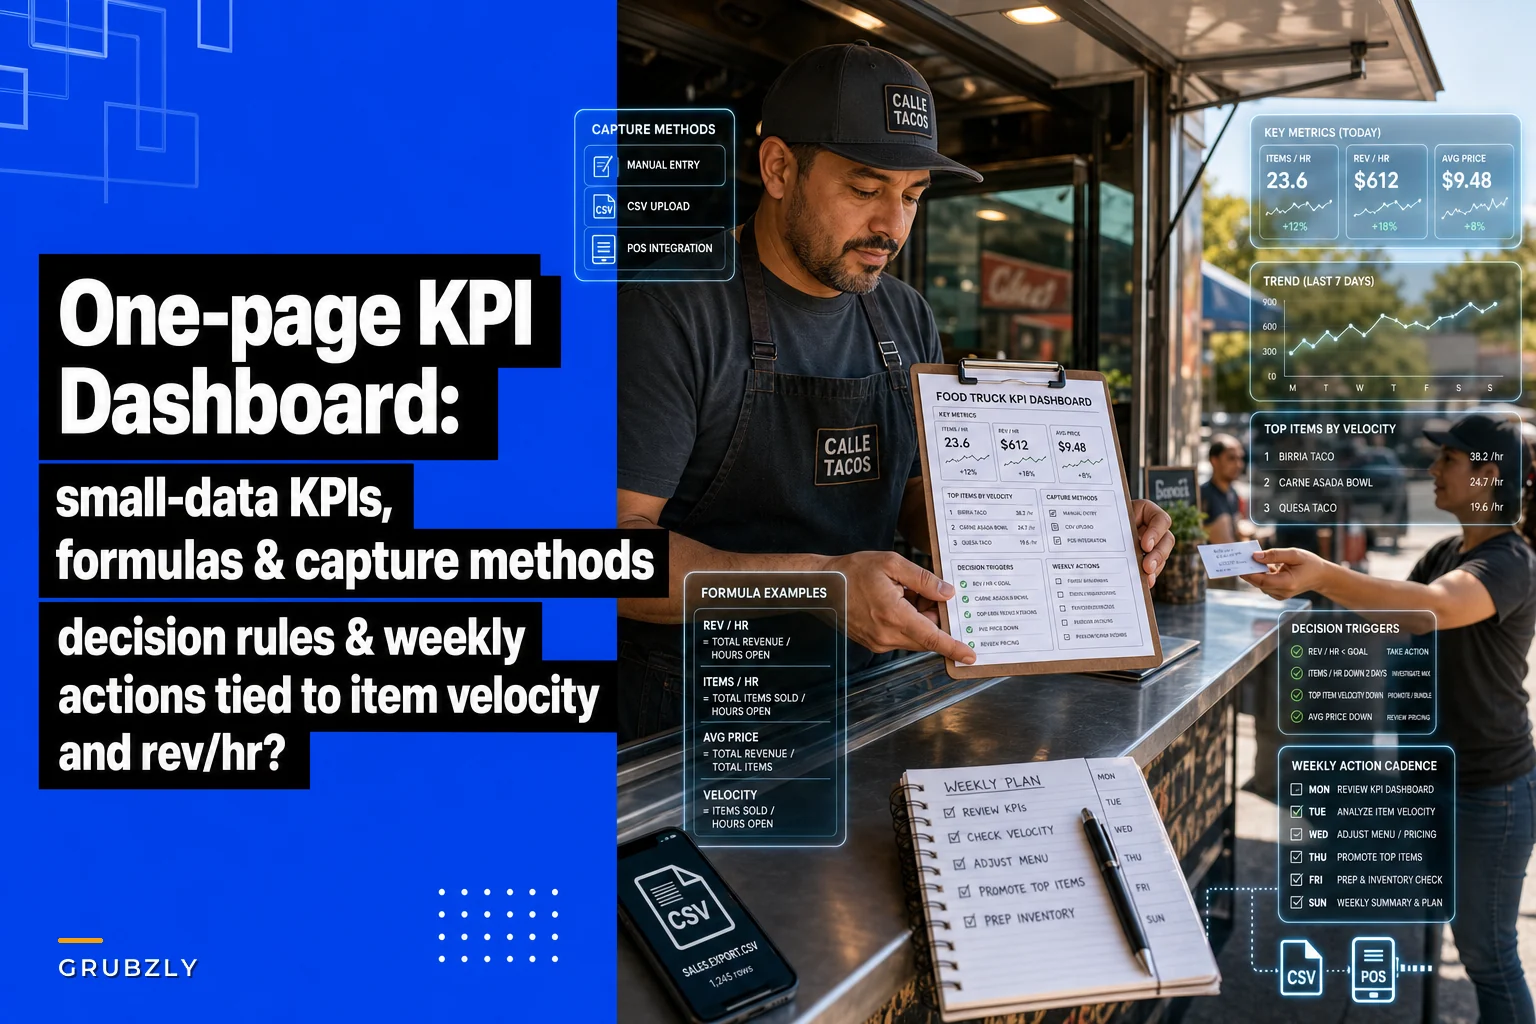

Most food truck operators track too much or too little. Either drowning in Square reports they never actually read, or flying blind with just a mental note of "today felt busy." Neither approach helps you decide whether to skip that Tuesday farmers market, switch your Wednesday menu, or finally drop that low-margin breakfast burrito everyone loves but nobody actually buys.
A food truck KPI dashboard isn't about data collection. It's about Monday morning decisions. Which stops to cut. Which menu items to push. When to restock. Where to park next week.
The best operators run their entire decision-making process off a single sheet of paper—or one screen if they've gone digital. Not 47 tabs in Excel. Not a Business Intelligence platform that requires a data science degree. Just one page with the numbers that actually predict whether next week will be profitable or painful.
The four metrics that predict next week's profit
After watching hundreds of food trucks operate, the difference between trucks clearing $8k weekly versus those struggling at $3k comes down to four specific numbers. Not revenue. Not food cost percentage. Not even customer count.
| Metric | Description |
|---|---|
| Item velocity by stop | How many tacos you sold at the brewery versus the office park tells you more than total sales ever will. A truck doing $800 at a lunch spot selling 120 items has a different problem than one doing $800 selling 65 items. The first needs to raise prices or upsell. The second needs to speed up service or expand capacity. Track this daily, but make decisions weekly. Three consecutive slow Tuesdays at the same stop means you need a new Tuesday stop, not better marketing. |
| Revenue per service hour | Not revenue per day. Not even revenue per stop. Revenue per hour you're actually serving customers. A four-hour farmers market bringing in $1,200 sounds great until you realize your two-hour lunch service downtown generates $900. Add setup, breakdown, and drive time, and that farmers market is quietly costing you money. Most operators never calculate this because it requires tracking actual service windows, not just daily totals. But this single metric will reshape your entire weekly route. |
| Prep-to-service ratio | How many prep hours go into each service hour? Nobody tracks this, and it shows. That pulled pork taking 14 hours of smoking for a 4-hour service? You're running a 3.5:1 ratio. Switch to pre-smoked and finished on the truck and you're at 0.5:1. Same taste, completely different profit structure. This metric alone determines whether you can handle back-to-back events or need recovery days between services. |
| Next-day readiness percentage | Can you operate tomorrow at 85% capacity without any additional prep or procurement? This number tells you whether you're one sick employee or one missing delivery away from canceling service. Track what percentage of tomorrow's needs are already handled: proteins prepped, sides ready, supplies stocked, truck fueled. Anything below 70% means you're always scrambling. |
Item velocity by stop How many tacos you sold at the brewery versus the office park tells you more than total sales ever will. A truck doing $800 at a lunch spot selling 120 items has a different problem than one doing $800 selling 65 items. The first needs to raise prices or upsell. The second needs to speed up service or expand capacity. Track this daily, but make decisions weekly. Three consecutive slow Tuesdays at the same stop means you need a new Tuesday stop, not better marketing.
Revenue per service hour Not revenue per day. Not even revenue per stop. Revenue per hour you're actually serving customers. A four-hour farmers market bringing in $1,200 sounds great until you realize your two-hour lunch service downtown generates $900. Add setup, breakdown, and drive time, and that farmers market is quietly costing you money. Most operators never calculate this because it requires tracking actual service windows, not just daily totals. But this single metric will reshape your entire weekly route.
Prep-to-service ratio How many prep hours go into each service hour? Nobody tracks this, and it shows. That pulled pork taking 14 hours of smoking for a 4-hour service? You're running a 3.5:1 ratio. Switch to pre-smoked and finished on the truck and you're at 0.5:1. Same taste, completely different profit structure. This metric alone determines whether you can handle back-to-back events or need recovery days between services.
Next-day readiness percentage Can you operate tomorrow at 85% capacity without any additional prep or procurement? This number tells you whether you're one sick employee or one missing delivery away from canceling service. Track what percentage of tomorrow's needs are already handled: proteins prepped, sides ready, supplies stocked, truck fueled. Anything below 70% means you're always scrambling.
Building your capture system without drowning in data entry
The fastest way to kill a food truck KPI dashboard is requiring 45 minutes of data entry after a 12-hour shift. You'll do it twice, then never again.
Stop losing sales to poor planning.
Grubzly helps you plan routes, track inventory, and maximize daily sales effortlessly.
- Real-time route optimization
- Inventory tracking & alerts
- Mobile sales & reporting
No credit card required
Manual entry that takes 90 seconds End of each stop: Write three numbers on an index card taped to your dashboard. Items sold. Revenue. Service time. That's it. Thirty seconds. End of shift: Transfer to your one-page sheet. Add prep hours and tomorrow's readiness. Another minute. This gives you 80% of the insights with 5% of the work. Don't optimize what doesn't need optimizing.
CSV dumps that actually work Your POS exports everything. You need four columns. Item name, quantity, revenue, timestamp. Most operators export everything then spend hours "cleaning data." Stop. Export only what you need. If your POS can't do simple exports, you need a different POS, not better Excel skills. Square, Clover, and Toast all handle this. Set up a saved export template. Download weekly. Copy four numbers to your dashboard. Done.
The hybrid approach most trucks actually use POS for revenue and item count. Manual tracking for service hours and prep time. Phone photo of your prep list for readiness percentage. Sunday night: Pull your POS export, note your handwritten service hours, calculate your four metrics. Make three decisions for next week. Takes around 20 minutes. It's not perfect. But perfect systems don't survive food truck reality. This does.
Tape the index card somewhere visible so it actually gets used.
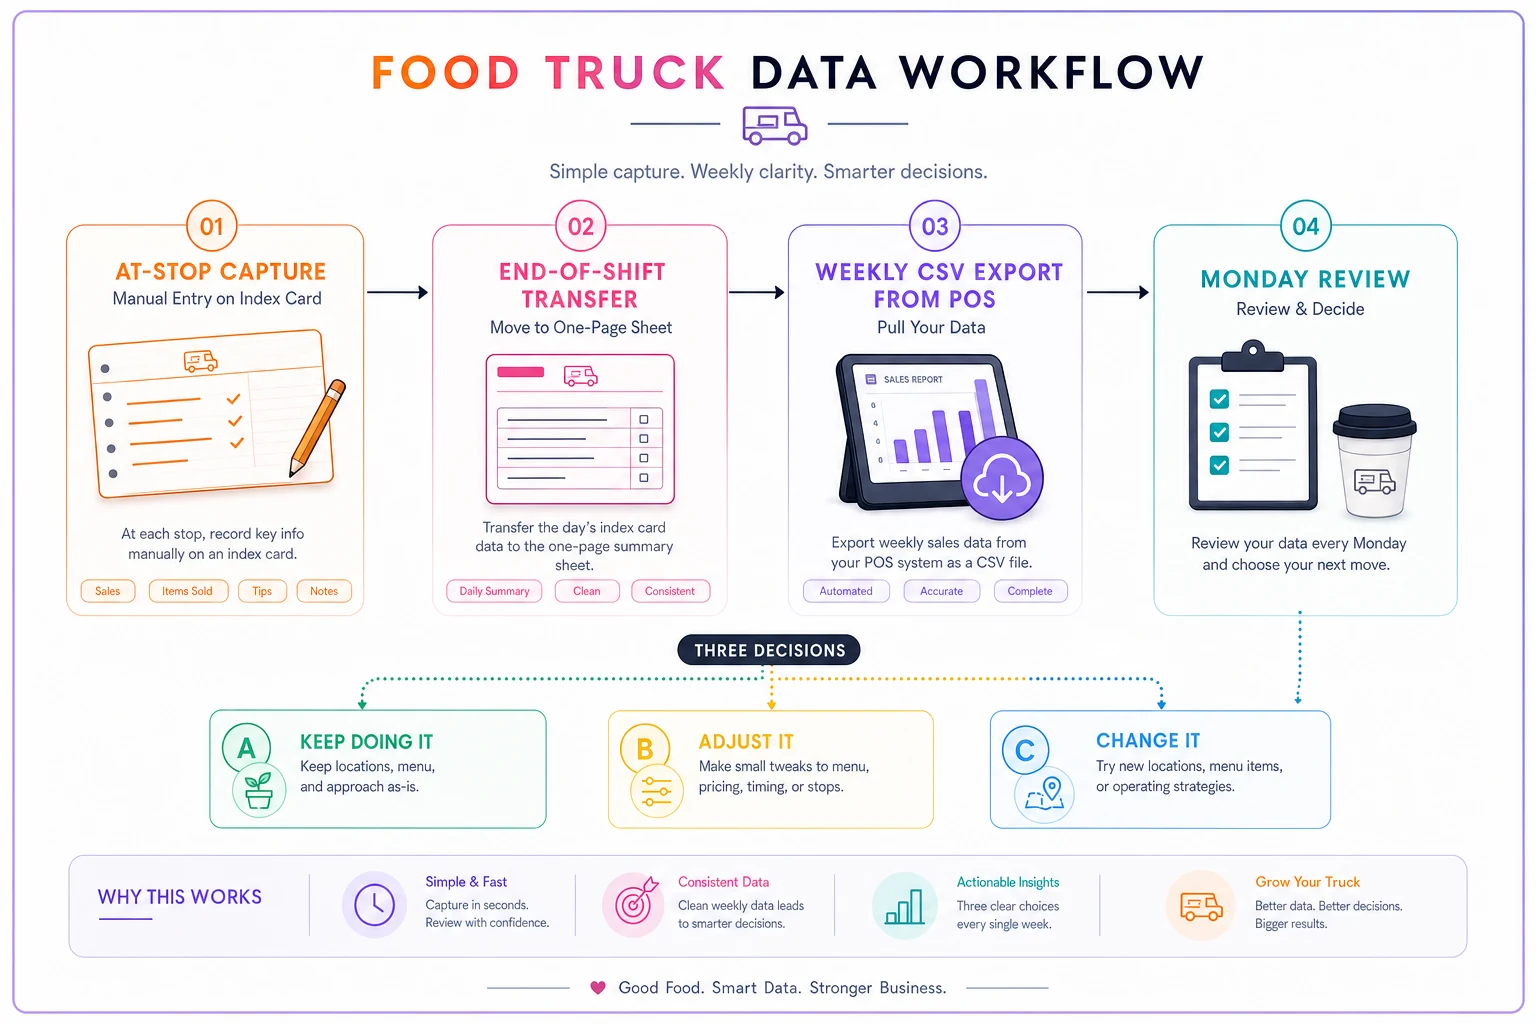
This visual makes the capture steps obvious and hard to skip.
Decision rules that remove the guesswork
Data without decision rules is just numbers on a page. Every metric needs a clear "if this, then that" trigger.
Item velocity triggers
-
Below 15 items per hour at any stop
Consider menu simplification or faster prep methods
-
Below 25 items per hour during lunch rush
You have a speed problem, not a demand problem
-
Any item selling less than 3 per stop
Cut it or bundle it
-
Top 3 items representing over 70% of sales
You're vulnerable to supply chain issues
Don't agonize over these decisions. The numbers make them for you.
Revenue per hour thresholds
-
Below $200/hour
Stop isn't worth your time unless it's a strategic location
-
$200–$300/hour
Maintain but don't prioritize
-
$300–$400/hour
Protect and expand these stops
-
Above $400/hour
Figure out why and replicate immediately
These thresholds vary by market. Downtown San Francisco might need $400 minimum. Rural areas might profit at $150. Adjust for your reality, but have clear numbers either way.
Prep-to-service boundaries
-
Above 2
1 ratio: Simplify menu or batch prep differently
-
1
1 to 2:1: Sustainable for specialty items
-
Below 1
1: Sweet spot for regular menu items
-
Below 0.5
1: Could handle more complex items for differentiation
The best trucks run a mixed model. Two complex signature items at 2:1, five standard items at 1:1, and three quick items at 0.5:1.
Readiness percentage minimums
-
Below 60%
Cancel or simplify tomorrow's service
-
60–70%
Operate but expect stress
-
70–85%
Normal operations
-
Above 85%
Can handle surprises or add services
Never start a week below 70% readiness. You're setting yourself up for cascade failures.
Your Monday morning 15-minute review
Every successful truck operator I know runs through the same Monday routine. Coffee, one-page dashboard, three decisions. Not a two-hour planning session. Not a team meeting. Fifteen minutes with clear data.
Week-over-week comparison Look at last week's four metrics versus the previous week. Not month over month. Not year over year. Week over week. Food trucks live and die by the week. Identify the single biggest change. Item velocity dropped 20%? Revenue per hour jumped? Prep ratio exploded? Focus only on the biggest mover. That's your problem to solve or advantage to push.
The three-decision framework
-
One stop to change (add, remove, or relocate)
-
One menu item to adjust (add, remove, modify, or reprice)
-
One operational change (prep method, service window, staffing)
Three decisions. Not ten. Not a complete overhaul. Three specific changes you'll implement this week.
Wednesday check-in Wednesday at 2pm, after lunch service. Pull up your dashboard. Are this week's numbers trending toward your targets? If not, you still have two days to adjust. This isn't a full review. Just a quick gut check. Five minutes max.
When complex tracking actually hurts your business
The temptation is always to track more. Customer demographics. Weather correlations. Seasonal trends. Competitive analysis.
A taco truck in Austin spent $3,000 on analytics software tracking 47 different metrics. They spent so much time analyzing data they forgot to optimize operations. Revenue dropped roughly 20% in three months while they had "perfect visibility."
Meanwhile, a dumpling truck in Portland tracks four numbers on a printed sheet. They grew from around $4k to $11k weekly over eight months. Same market conditions. Same food truck challenges. Different focus.
The metrics that sound important but aren't
-
Customer satisfaction scores (unless below 4 stars)
-
Exact food cost percentage (rough ranges are fine)
-
Daily social media engagement
-
Competitor pricing analysis
-
Weather-adjusted projections
These might matter for restaurants. For food trucks, they're procrastination disguised as strategy.
Signs you're over-tracking
-
Your dashboard takes more than 5 minutes to update
-
You have metrics you haven't looked at in two weeks
-
You're tracking things you can't actually change
-
Data entry takes longer than 2 minutes per day
-
You have more than one page or screen
When you catch yourself adding a fifth metric, ask: What decision will this actually change? If you can't name a specific action, don't track it.
Building formulas that actually reflect food truck reality
Most dashboard formulas assume perfect conditions. Consistent hours. Stable locations. Predictable demand. Food trucks have none of these.
Weighted location averaging Don't average all stops equally. Weight by frequency and importance. Downtown lunch three times a week counts more than Saturday farmers market once a week. Build this into your velocity calculations or you'll optimize for the wrong stops. Simple formula: (Metric × Days at Location) / Total Days This prevents one amazing Saturday from hiding five mediocre weekdays.
Service hour reality adjustments Official hours: 11am–2pm (3 hours) Actual service: 11:20am–1:45pm (2.5 hours) Always use actual service time. Those 30 minutes matter when calculating hourly metrics. Track when your first customer orders and when your last customer pays.
The "could you serve" principle Readiness percentage isn't about perfection. It's about ability to operate. Out of your special sauce but have backup condiments? That's 90% ready, not 0%. Missing one protein but have others? Still 80% ready. The formula: (Items You Could Serve / Total Menu Items) × (Supplies on Hand / Typical Daily Needs)
Software without the complexity
Most food truck operators either overspend on complex systems or suffer with paper forever. You don't need either extreme.
A basic operational platform handles the CSV imports from your POS, calculates your four metrics automatically, and shows your Monday morning dashboard without any Excel formulas. This isn't about fancy automation—it's about removing the Sunday night spreadsheet hassle that makes you skip weeks.
Where AI-assisted platforms add real value is in the decision rules. Instead of staring at numbers wondering what they mean, the software flags when metrics cross your thresholds and surfaces specific actions. Something like: "Revenue per hour at Thursday's office park dropped below $200 for three straight weeks. Consider relocating or adjusting the menu for this stop."
A Google Sheet works fine if you're disciplined. The discipline is the hard part, not the tool.
Making the dashboard drive actual decisions
The difference between trucks that use dashboards successfully and those that abandon them after two weeks comes down to whether the metrics connect to actions.
Every Sunday, after updating your metrics, write three specific actions at the bottom of your dashboard:
Stop decision: "Skip Tuesday farmers market, try the construction site on 5th instead"
Menu decision: "86 the mushroom flatbread, add second vegetarian taco option"
Operational decision: "Pre-portion Thursday and Friday proteins on Wednesday night"
If you can't generate three decisions from your metrics, your dashboard isn't calibrated correctly. Adjust your thresholds until the numbers force choices.
A breakfast burrito truck in Denver started this practice and went from "feeling busy but not profitable" to clearing an extra $1,500 weekly within two months. Same locations. Same menu. Just better decisions from cleaner data.
The dashboard that survives reality
Your food truck KPI dashboard will fail if it requires perfection. It needs to survive forgotten entries, busy weeks, broken printers, and general chaos.
Design for failure. Miss a day of tracking? Your weekly averages still work. POS export breaks? Manual entry covers you. Too exhausted Sunday night? Wednesday's numbers still tell enough of a story for decisions.
The best dashboard isn't the most comprehensive. It's the one you'll still be using six months from now when you're tired, busy, and successful enough that tracking feels less urgent.
Four metrics. Weekly decisions. One page. That's the food truck KPI dashboard that actually drives growth.
Most operators who implement this see meaningful changes within three weeks. Not because the dashboard is magic. But because they're finally making decisions based on patterns instead of feelings. And in the food truck business, where margins are thin and weeks are long, that's the difference between surviving and thriving.
Four metrics. Weekly decisions. One page. That's the food truck KPI dashboard that actually drives growth.
Most operators who implement this see meaningful changes within three weeks. Not because the dashboard is magic. But because they're finally making decisions based on patterns instead of feelings. And in the food truck business, where margins are thin and weeks are long, that's the difference between surviving and thriving.
Ready to drive your food truck business forward?
Join 2,000+ food truck operators relying on Grubzly to boost efficiency, increase sales, and delight customers.