



Most food truck fleets don't have a data problem. They have a definition problem. Two trucks report "sales" and one includes tips while the other doesn't. Your commissary manager logs "waste" in pounds, your POS logs it in dollars, and your spreadsheet quietly averages the two into a number that means nothing. By the time you're running three or four trucks, nobody actually knows which figure is real — they just know the dashboard says something and the bank says something else.
This is where most integration setups fall apart. Operators reach for Zapier, Make, or a Google Sheets sync, wire up a few connections, and assume the plumbing is the hard part. The plumbing is easy. The hard part is agreeing on what each field means, who owns it, and how fast it needs to update. Get that wrong and every automation downstream just moves bad data faster.
So this piece is about the boring layer nobody wants to build: a small canonical metric catalogue, a couple of clean CSV shapes, a RACI ownership matrix, and a handful of SLA rows you can literally copy into a doc today. The stuff that turns a pile of no-code connections into something you can actually trust when you're deciding whether to keep a Thursday lunch stop.
Why food truck data breaks before it even syncs
The reason food truck integration architecture goes sideways isn't the tooling. It's that a truck generates data from four or five disconnected sources — POS, cash drawer, inventory counts, fuel/generator logs, and whatever the shift lead scribbled on a clipboard — and each source has its own idea of a "day," a "sale," and a "location."
A typical example: your POS closes the business day at 3am to catch late catering. Your commissary counts inventory at 6am. Your accounting export runs on calendar days. So when you ask "what did Truck 2 sell on Tuesday at the tech park," three systems give you three answers that are all technically correct and completely useless together.
The three ways garbage gets in
-
Undefined fields. "Revenue" exists in four places with four meanings.
-
Silent ownership gaps. A field updates, but nobody is responsible for it being correct, so errors sit for weeks.
-
No timing contract. A sync "runs daily," but nobody agreed on when daily, so month-end reconciliation catches figures mid-update.
Fix those three and you've solved most of what breaks. Everything below is just the mechanism for doing it.
The canonical metric catalogue (start with 12, not 50)
A canonical metric catalogue is a single list where each metric is defined once, given one name, and mapped to exactly one source of truth. Not a wish list. The temptation is to define everything — don't. Start with the twelve metrics that actually drive weekly decisions and leave the rest as raw fields until someone genuinely needs them. Here's a workable starter catalogue for a small fleet:
Stop losing sales to poor planning.
Grubzly helps you plan routes, track inventory, and maximize daily sales effortlessly.
- Real-time route optimization
- Inventory tracking & alerts
- Mobile sales & reporting
No credit card required
| Canonical name | Definition (one sentence) | Unit | Source of truth | Grain |
|---|---|---|---|---|
net_sales | Gross sales minus refunds and comps, excluding tax and tips | USD | POS export | per truck / per service day |
tax_collected | Sales tax charged on transactions | USD | POS export | per truck / per service day |
tips_collected | Tips via card and cash, combined | USD | POS + drawer reconciliation | per truck / per service day |
transactions | Count of completed sales | count | POS export | per truck / per service day |
service_day | Operational day boundary (e.g. 4am–4am local) | date | Ops calendar | fleet-wide rule |
stop_id | Unique code for a location+window | string | Route plan | per stop |
cogs_used | Cost of ingredients consumed | USD | Inventory count delta | per truck / per service day |
waste_qty | Product discarded, in defined units | kg | Prep log | per truck / per service day |
labor_hours | Paid hours worked on shift | hours | Schedule/clock | per truck / per service day |
fuelgeneratorcost | Fuel + generator spend | USD | Fuel log | per truck / per service day |
catering_revenue | Booked event revenue, invoiced | USD | Catering system | per event |
stop_active | Whether a scheduled stop actually ran | bool | Shift lead confirm | per stop |
Two things make this catalogue work. First, every metric names its grain — the level it's measured at. Mixing grains is the single most common reason a dashboard lies. netsales at "per service day" can never be silently compared to cateringrevenue at "per event" without an explicit rollup rule. Second, service_day is itself a defined metric. That sounds pedantic until you realize half your reconciliation fights are actually calendar-boundary fights in disguise.
One thing worth flagging specifically: keep tipscollected separate from netsales forever. Fleets that fold tips into revenue to make a truck look healthier end up mispricing stops and distorting labor calculations, and it quietly poisons your per-stop P&L.
Minimal CSV shapes your syncs can actually pass
No-code tools move rows. If the rows are messy, the tool faithfully delivers mess. Define two or three minimal CSV shapes and make every source conform to them before the sync touches anything. Minimal means: only the fields you defined, named exactly as in the catalogue, one grain per file.
Daily truck summary (truck_day.csv) — one row per truck per service day:
| service_day | truck_id | stop_id | net_sales | tax_collected | tips_collected | transactions | cogs_used | waste_qty | labor_hours | fuel_generator_cost |
|---|---|---|---|---|---|---|---|---|---|---|
| 2025-06-10 | T2 | STOP-TECHPARK-LUNCH | 1840.50 | 152.34 | 210.00 | 143 | 612.20 | 3.4 | 18.5 | 41.10 |
| 2025-06-10 | T2 | STOP-BREWERY-PM | 980.00 | 81.20 | 95.50 | 71 | 300.00 | 1.1 | 9.0 | 22.00 |
Stop activity (stop_log.csv) — one row per scheduled stop, whether it ran or not:
| service_day | truck_id | stop_id | scheduled_start | scheduled_end | stop_active | notes |
|---|---|---|---|---|---|---|
| 2025-06-10 | T2 | STOP-TECHPARK-LUNCH | 11:00 | 14:00 | true | |
| 2025-06-10 | T2 | STOP-CITYHALL-LUNCH | 11:00 | 14:00 | false | permit hold |
Notice stop_log.csv records the stops that didn't run. That's deliberate. If your only data comes from stops that produced sales, you can't tell the difference between a stop that flopped and one that never happened. That gap wrecks routing decisions — you keep "optimizing" a stop that was cancelled twice.
A few CSV rules that save real pain:
-
Dates in ISO format (
YYYY-MM-DD). Regional date formats in CSVs cause a surprising amount of quiet corruption when files cross tools. -
No blended rows. One file, one grain. Don't put a per-event catering total in the per-day truck file.
-
Empty is empty, zero is zero. A blank
waste_qtymeans "not recorded." A0means "we checked, there was none." Different meaning, different decision. -
Stable IDs.
truckidandstopidnever change spelling. "T2" today can't become "Truck 2" next month or your joins silently drop rows.
These aren't edge cases. Every one of them has caused a real reconciliation failure somewhere.
A machine-readable manifest so tools and humans agree
The catalogue lives in a doc; the manifest makes it enforceable. A manifest is just a small structured file that describes each field's name, type, unit, source, and owner. Your no-code sync — or a validation step in front of it — reads the manifest and rejects rows that don't match. Humans read the same file to settle arguments.
Keep it simple. YAML or JSON both work: version: 1 servicedayrule: "04:00-04:00 local" metrics: netsales: type: number unit: USD source: posexport grain: truckserviceday owner: opslead nullable: false wasteqty: type: number unit: kg source: preplog grain: truckserviceday owner: shiftlead nullable: true stopactive: type: boolean source: shiftconfirm grain: stop owner: shiftlead nullable: false files: truckday.csv: grain: truckserviceday required: [serviceday, truckid, netsales, transactions] stoplog.csv: grain: stop required: [serviceday, truckid, stopid, stopactive]
The value isn't the syntax — it's that nullable: false on net_sales means a sync literally cannot pass a blank sales figure downstream. Instead of finding the hole at month-end, someone gets a rejected row the same day, while they still remember what happened. That's the whole point: catch garbage at the door, not at the dashboard.
The manifest also functions as the authoritative reference when someone wants to add a field or rename something mid-season. Without it, those changes happen informally and break things quietly. With it, changes require updating a file, which creates a moment of friction that's usually enough to make people think twice before touching the schema during a busy week.
Ownership: a RACI matrix that stops "I thought you had it"
Every field in your catalogue needs one name attached to correctness. Not "the team" — a person. The most reliable predictor of a clean dataset in a small fleet isn't the tooling budget, it's whether each metric has a single accountable owner who notices when something looks off.
Here's a compact RACI for the core metrics. R = does the work, A = accountable it's right, C = consulted, I = informed.
| Metric / task | Shift lead | Ops lead | Commissary mgr | Bookkeeper | Owner |
|---|---|---|---|---|---|
net_sales correctness | R | A | I | C | I |
tips_collected reconciliation | R | C | A | I | |
waste_qty logging | A/R | C | I | I | |
cogs_used (count delta) | C | I | A/R | C | I |
stop_active confirmation | A/R | C | I | ||
fuelgeneratorcost | R | A | C | I | |
| Manifest / catalogue changes | R | C | C | A | |
| Month-end reconciliation | I | C | C | A/R | I |
One rule that matters more than the grid itself: only one A per row. The moment two people are "accountable" for cogs_used, nobody is. When a fleet grows, ownership is the first thing to get fuzzy — the founder used to own everything and now half of it is unassigned. Writing this matrix down is often the highest-leverage hour in the whole integration project. It's the same principle that keeps quality from cracking as you add trucks, covered in more depth in scaling from one truck to a fleet.
SLAs: the timing contract nobody writes down
An SLA here just means: when is each field expected to be updated and correct, and what happens when it's late. Without this, "the sync runs daily" is meaningless — your reconciliation might run before the sync finishes. Copy these rows into a doc and adjust the times to fit your operation:
| Data / sync | Update window | Owner | Late-if | On breach |
|---|---|---|---|---|
POS net_sales export | By 6:00am next service day | Ops lead | >6:00am | Flag row, ops lead checks POS export manually |
| Cash drawer / tips reconcile | By noon next service day | Bookkeeper | >noon | Truck's day marked "unreconciled," excluded from KPIs |
stop_active confirmation | Within 30 min of stop end | Shift lead | >2 hrs after end | Ops lead texts shift lead; stop logged as unknown |
Inventory count / cogs_used | By 8:00am | Commissary mgr | >8:00am | COGS estimated, flagged as provisional |
| Manifest changes | 48 hrs before taking effect | Ops lead | n/a | No mid-week schema changes allowed |
The on breach column is the part people skip, and it's the part that actually protects your numbers. A breach shouldn't silently produce a wrong figure — it should produce a flag. A day marked "unreconciled" and pulled from the dashboard is honest. A day that quietly shows partial sales as if they were final is what makes you distrust the whole system a month later.
One SLA worth defending hard: no schema changes mid-week. Fleets love to add a field on a busy Friday, and by Monday three files don't match the manifest and the sync is dropping rows nobody noticed. Freeze the shape during operating days.
A workflow that ties it together
Here's how the pieces actually move through a normal service day, end to end:
-
Shift lead confirms each
stop_activewithin 30 minutes of the stop ending — even the cancelled ones. -
POS closes on the defined
servicedayboundary overnight and exportstruckday.csvfields. -
A validation step reads the manifest and checks every row
right names, right types, no nulls where
nullable: false. Bad rows get bounced back with a reason, not silently dropped. -
Commissary logs the inventory count that produces
cogsused; the bookkeeper reconciles the drawer fortipscollected. -
Clean rows land in one canonical table — the only place the dashboard reads from.
-
Anything that missed its SLA window shows up on an exceptions list, flagged, not hidden.
This diagram shows the daily validation and canonical table write flow.
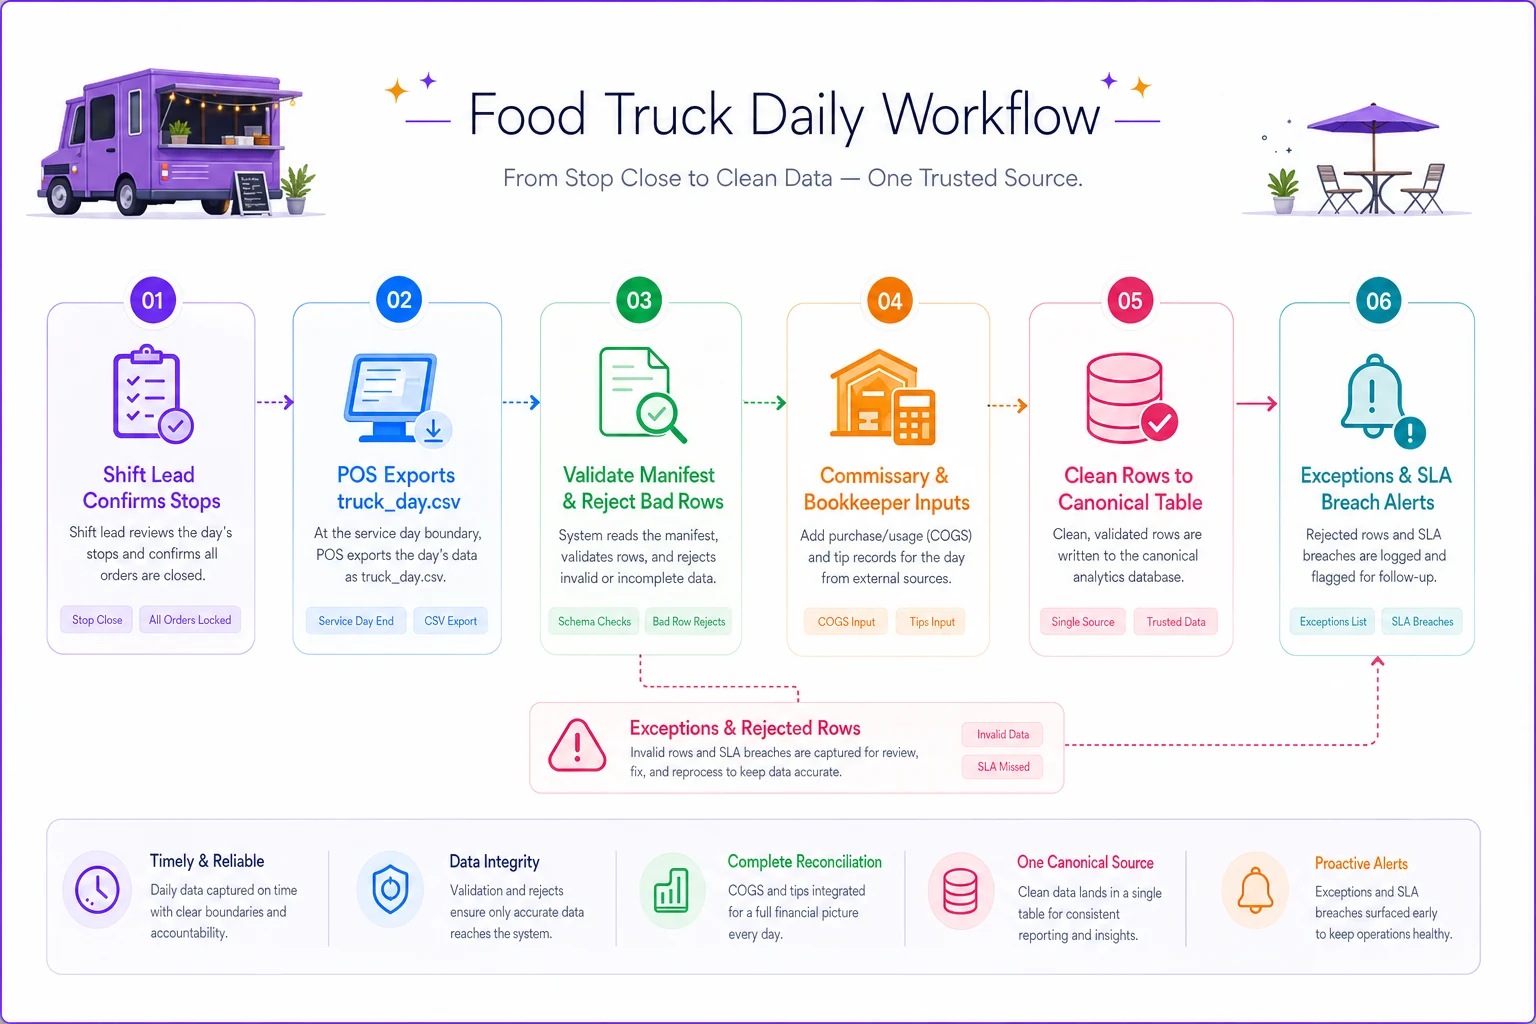
The important design choice is step 5: there is exactly one canonical table, and the dashboard reads only from it. Every source can be messy in its own way, but they all get normalized to the catalogue before anything downstream sees them. This is the same discipline that makes commissary-to-truck handoffs reliable — one agreed record, signed off — which is worth reading alongside the commissary-to-truck transfer checklist.
The whole flow takes maybe 20 minutes of human time across the team each day when it's running well. Most of that is the shift lead confirmation at stop close. The validation step and canonical table write happen automatically. The exceptions list is where you spend your attention — and it should be short most days.
A short real scenario
A three-truck taco fleet in a mid-size metro was running Zapier from their POS into a shared sheet, plus manual inventory entry. Their reported COGS bounced between roughly 26% and 41% week to week, which made every menu-pricing conversation useless because nobody believed the number.
The fix wasn't more automation. They defined a 12-metric catalogue, set the service_day boundary at 4am — they'd been mixing 3am POS closes with calendar-day accounting — assigned one accountable owner per metric, and added a validation step that rejected blank sales and blank inventory rows.
Nothing about the tooling got fancier. Within about six weeks, reported COGS settled into a believable 29–33% band. The biggest shift was cultural: shift leads started confirming cancelled stops because a flagged unknown showed up on Monday with their name next to it. They found somewhere around $600–$900 a month in "phantom" waste that had actually been mis-logged transfers between trucks. Not a revenue miracle. Just numbers people could finally trust enough to act on.
When this is worth building — and when it isn't
When it makes sense: you're running two or more trucks, more than one person touches the data, or you've had a month-end where the numbers didn't reconcile and nobody could explain why. That's the signal that the shared mental model has broken and you need it written down.
When it's overkill: a single truck with the owner doing everything. You don't need a manifest to argue with yourself. Track the raw fields cleanly and revisit this the day you hire your first bookkeeper or add truck number two.
Who should not do this yet: operators who haven't decided their service_day boundary or which system is the source of truth for sales. Don't build the catalogue on top of an unresolved definition — you'll just encode the confusion. Settle the boundary and the source of truth first; everything else follows from those two decisions.
The takeaway
Integration architecture for a small fleet isn't about connecting more tools. It's about deciding what your numbers mean before the tools start moving them, naming one owner per metric, and agreeing on when each field is supposed to be accurate. The catalogue, the CSV shapes, the manifest, the RACI, and the SLA rows are all just ways of making those decisions explicit and enforceable.
Build the boring layer first. The syncs are trivial once everyone's measuring the same thing — and every automation you add after that is finally moving good data instead of amplifying the mess.
Ready to drive your food truck business forward?
Join 2,000+ food truck operators relying on Grubzly to boost efficiency, increase sales, and delight customers.