
Every food truck operator knows their bestsellers. Ask about the fish tacos at the downtown office building versus the brewery district, and they'll tell you exactly which location moves more product. But what most operators miss is that the brewery stop might actually lose money once you factor in the 35-minute drive, slower service pace, and the fact that your high-margin items barely move there.
The real profit killer is running the same full menu at every stop without understanding which items actually make money at each location. You're hauling ingredients, prepping portions, and burning drive time for items that shouldn't even be on the board at certain stops.
Why location-blind menus destroy margins
There's this assumption in food truck operations that consistency means offering everything everywhere. But mobile food is fundamentally different from brick-and-mortar. Your costs shift dramatically between stops — not just in sales volume, but in operational complexity.
Take a taco truck running 15 menu items across 5 daily stops. At the office park, customers order fast, pay quick, and you're cranking out 80 transactions in 90 minutes. Same truck, same menu at the late-night bar scene? You're lucky to hit 40 transactions in 2 hours, with way more special requests and people changing their orders mid-prep.
Drive time alone changes your entire cost structure. That profitable chicken bowl becomes a loss leader when you're burning 40 minutes round-trip to serve a dozen of them at a suburban office complex. Meanwhile, you run out of the high-margin loaded nachos that actually sell at that location because you didn't adjust your prep quantities.
Most operators track daily revenue and food costs. Some even track by stop. But almost nobody calculates true contribution margin by menu item by location. That's where the money leaks — through thousands of small decisions about what to offer where.
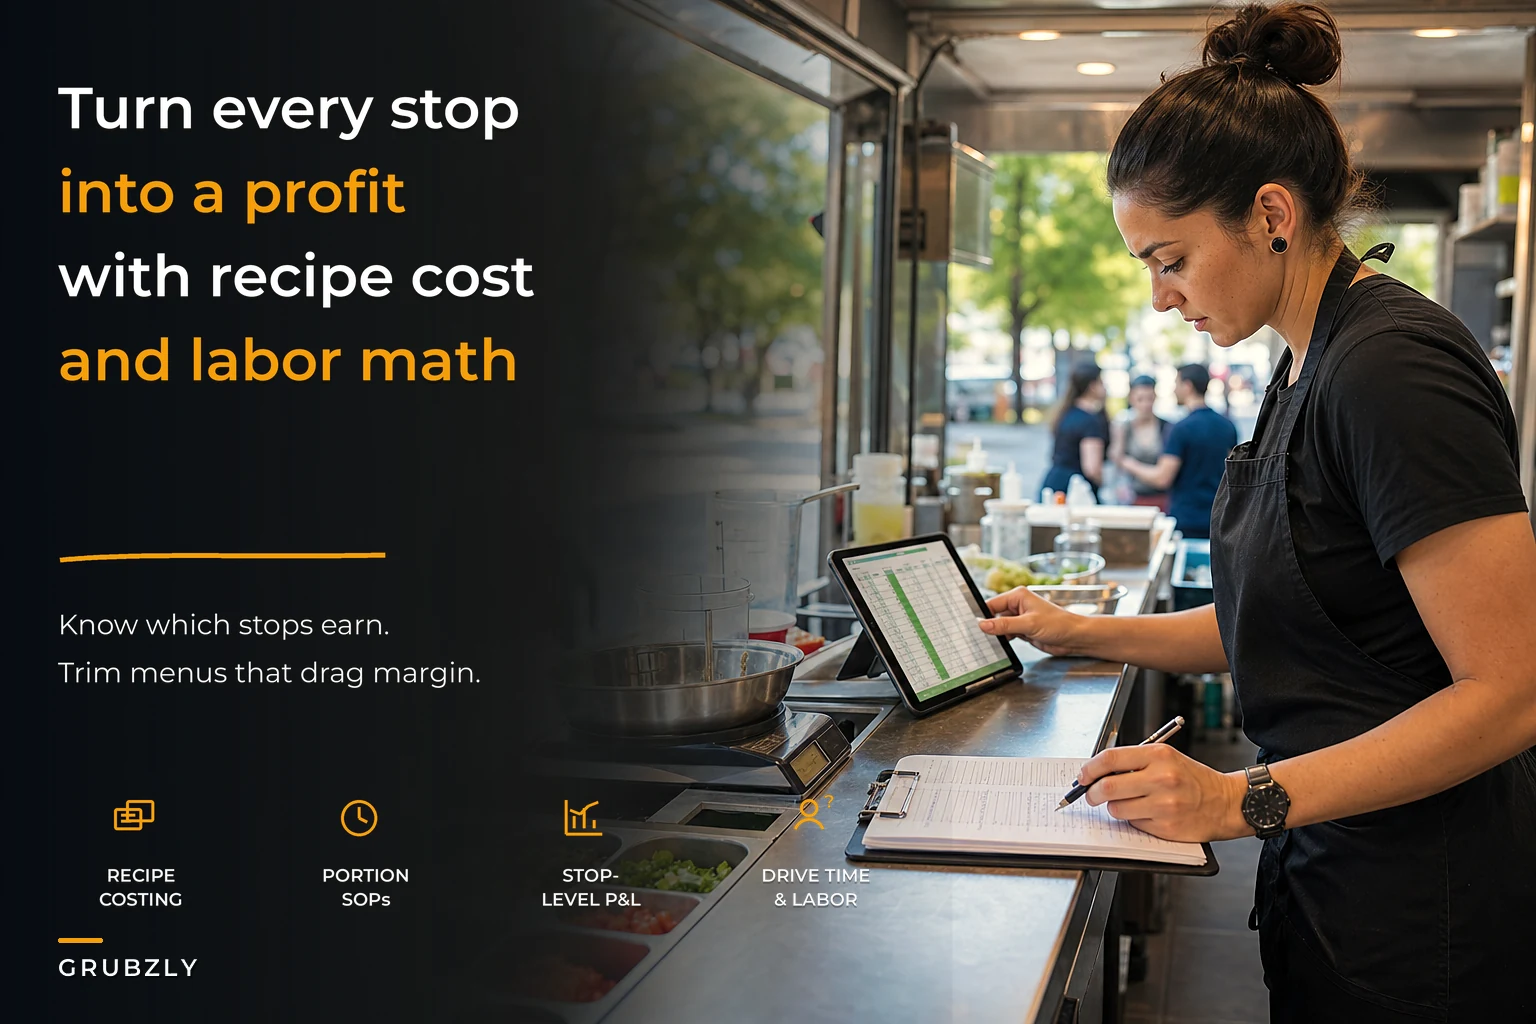
Building your recipe costing foundation
Before you can optimize by stop, you need accurate recipe costs. Not the "flour costs about 50 cents per cup" estimation most trucks run on — real portion-level costing that includes every component.
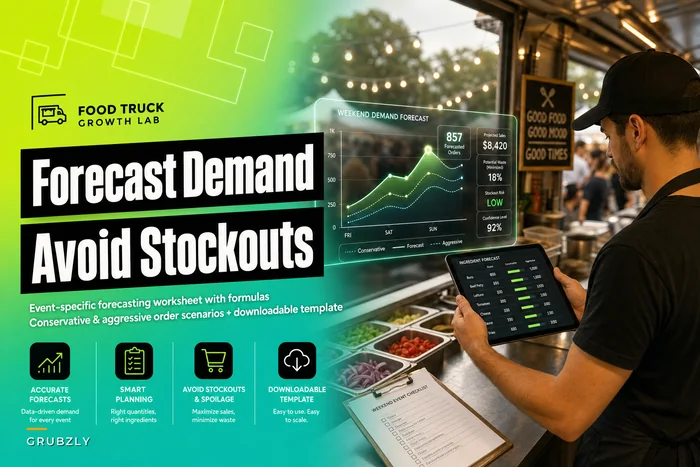
Stop losing sales to poor planning.
Grubzly helps you plan routes, track inventory, and maximize daily sales effortlessly.
- Real-time route optimization
- Inventory tracking & alerts
- Mobile sales & reporting
No credit card required
Start with your top 5 sellers and break them down to the gram. That means accounting for protein portions (raw weight vs. cooked yield), every sauce and condiment by actual portion, garnishes and toppings by standard serving, packaging specific to that item, and napkins, utensils, or sauce cups unique to that dish.
| Ingredient | Quantity | Cost |
|---|---|---|
| Chicken (raw) | 3oz | $0.92 |
| Corn tortillas | 3 | $0.18 |
| Onion | 20g | $0.04 |
| Cilantro | 5g | $0.06 |
| Lime wedge | 1 | $0.08 |
| Salsa verde | 1.5oz | $0.12 |
| Foil wrapper | 1 | $0.03 |
| Total food cost | $1.43 |
That's just the start. Now add labor complexity. Those tacos take about 45 seconds to assemble when your prep is dialed in. But a breakfast burrito that requires griddling eggs to order? That's closer to 2 minutes. At $18/hour labor cost, that's roughly 60 cents of labor for the burrito versus 22 cents for the tacos. Small difference per item, significant difference at volume.
The hidden costs of menu complexity by location
Different stops have different operational tempos, and this matters more than most operators realize. The downtown lunch rush is all about speed — predetermined combos, minimal customization, payment ready before they reach the window. The farmer's market is the opposite — people browse, ask questions, want modifications.
Your menu needs to match the operational reality of each stop. Running 15 items at a location where you only sell 6 means you're carrying extra inventory that might spoil, taking up prep space in your truck, slowing down order-taking with too many choices, and increasing the chance of running out of popular items.
The complexity multiplier is real. Each additional menu item at a slow stop adds roughly 8% to your operational overhead through increased prep, storage, and waste. At a fast stop where volume justifies variety, that same item might only add 3% overhead.
Portion control SOPs that actually work in a truck
Every restaurant has portion control procedures. In a truck — with different people working different shifts, often alone — those procedures fall apart fast. You need SOPs that account for the chaos of mobile service.
Build portion tools directly into your setup. Pre-portion proteins in labeled bags (not just "chicken" but "CT-3oz" for chicken taco portions). Use ladles and scoops that match exact portions and label them for what they're for. Tape visual guides inside the truck showing correct portions. Keep a scale at each station for spot-checking.
Pre-portion proteins in labeled bags like "CT-3oz" to speed service and enforce portion accuracy across different shifts.
Make the right portion easier than the wrong one. If someone has to search for the right scoop or guess at quantities, they'll overportion every time. Overportioning by just 15% on proteins can cost somewhere in the range of $300-400 weekly for a typical truck — quietly wrecking margins without anyone noticing.
Your portion SOPs need to specify not just quantities but presentation standards that naturally control portions. A taco that's properly wrapped can only hold so much filling. A bowl with ingredients placed in sections rather than piled prevents overserving.
Drive time changes everything about profitability
Every minute driving is a minute not serving — plus fuel, plus wear on your truck, plus opportunity cost of stops you're not hitting.
Take a real example. A brewery stop brings in $400 in revenue, which sounds solid until you factor in 25 minutes of drive each way (50 minutes total), $8 in fuel, $15 in labor for travel time, $180 in food costs (45% at this location due to menu mix), and $90 in on-site labor. Net contribution: $107.
Compare that to an office building 10 minutes away on the same $400 in revenue: $3 in fuel, $6 in travel labor, $140 in food costs (35% due to better menu mix), $60 in on-site labor. Net contribution: $191.
The brewery looks great on your daily sales report. The office building actually makes you money.
Creating your per-stop workbook
You need a system that captures true profitability by stop — not just revenue minus food cost, but everything that changes by location. Build a workbook with three core components:
Stop Profile: Average transaction value, transaction count, service time required, drive time from commissary, drive time to next stop, parking costs or permits, and peak vs. off-peak pricing ability.
Menu Performance by Stop: Items sold by quantity, actual menu mix percentages, items that never sell, customization frequency, and prep requirements unique to that stop.
True Costs: Food cost by actual mix sold, labor hours including setup and breakdown, travel time labor, fuel and vehicle costs, and any stop-specific supplies or requirements.
With this data, you can calculate contribution margin per stop-hour. That's what actually matters — not how much you sell, but how much you keep per hour invested.
This diagram shows the basic workflow for building and using the workbook.

Use the workbook to prioritize stops and adjust menus based on contribution per hour.
The power of simplified stop-specific menus
Once you see the real numbers, the solution becomes obvious: run different menus at different stops. Not completely different, but strategically reduced based on what actually sells and makes money at each location.
Your downtown lunch menu might be 6 items — all pre-preppable, all under 30 seconds to plate. Your weekend festival menu might include 10 items with high-margin specialty dishes that benefit from explanation. Your late-night bar menu might be 4 items: drunk-food friendly, hard to mess up.
The operational gains compound. Fewer choices mean faster service, better inventory control based on what you actually need, less waste from unsold items, higher average tickets, and simpler training across shifts.
Priority matrix for stop selection
With your contribution margin data in hand, you can build a stop priority matrix. Rank every potential stop by:
-
Contribution per hour — profit divided by total time investment
-
Reliability — consistency of sales, weather resistance
-
Growth potential — can you actually increase sales here?
-
Strategic value — does it lead to catering? Does it build brand recognition in the area?
The matrix surfaces surprises. That marginal Tuesday afternoon spot might be worth keeping because it's 5 minutes from your commissary and requires zero extra prep. The "amazing" Saturday festival might lose money once you factor in the permit, extra staff, and the complexity of hauling everything needed for 8 hours.
Some stops only make sense with menu modifications. The office park becomes profitable when you cut the menu to 5 fast items. The brewery works when you focus on shareable plates with better margins. The data makes these calls obvious — you just have to be willing to act on them.
How menu engineering compounds profits
Here's how this plays out in practice. A BBQ truck was running 12 items everywhere, struggling to clear $2,000 weekly profit on $15,000 in sales. Their brisket sandwich was the star item, but overall food cost sat at 38%.
After building their per-stop workbook, they discovered that office stops were dominated by brisket sandwiches while sides barely moved, brewery stops saw loaded fries and nachos fly but sandwiches sat, and event stops did well with combo plates that took forever to serve.
-
Offices
5 items, all sandwiches, all under $12, sides eliminated
-
Breweries
4 shareable plates, no individual sandwiches
-
Events
pre-made combo boxes only, no à la carte
After 8 weeks, food costs dropped to 32% from better mix and less waste, service speed increased roughly 40% at office stops, weekly profit jumped to $3,400 on similar revenue, and they dropped 2 unprofitable stops and replaced them with 3 better ones.
The key wasn't working harder or selling more. It was understanding which menu items made money at which stops, then having the discipline to simplify around that reality.
Seasonal adjustments and menu evolution
Stop-level profitability shifts seasonally. The park that's gold in summer becomes worthless in winter. The office building that's steady year-round becomes your anchor during slow periods.
Track contribution margins monthly and adjust. Run a limited hot menu in winter at stops where cold items don't sell. Skip marginal stops entirely during slow periods and double down on your core profitable locations.
Menu evolution should be stop-specific too. Test new items at your most forgiving locations first — the ones where customers know you and trust you. Roll successful items to other stops only if they fit the operational profile of that location. Not every menu win travels well.
Technology that makes this manageable
Manual tracking of stop-level profitability is genuinely brutal. You need systems that capture real data without adding hours of admin work. Modern operational platforms can track actual sales by item by location, portion compliance through inventory reconciliation, labor hours mapped to specific stops, route optimization including drive time, and real-time margin calculations.
The best solutions integrate your POS data with inventory tracking and labor management. You see contribution margin by stop updated daily, not whenever you get around to updating a spreadsheet. AI-powered platforms can also surface patterns you'd miss manually — flagging which items to cut at which stops before the cost of keeping them becomes obvious.
These platforms turn hunches into data. Instead of feeling like the brewery stop is great because it seems busy, you know exactly where it ranks in contribution per hour. You can test menu changes and see the impact within days.
Making the hard cuts
The hardest part isn't the analysis — it's acting on what you find. Cutting menu items feels like admitting defeat. Dropping stops with regular customers seems wrong. But profitable operations require these decisions.
Start with one stop. Pick your worst performer by contribution margin and either fix it or cut it. Usually that means dramatically simplifying the menu, adjusting service hours to just peak times, changing your prep strategy for that location, or admitting it doesn't work and moving on.
Give changes 2-3 weeks to show results. Track everything. If contribution margin doesn't improve meaningfully, cut the stop. That freed-up time lets you hit better locations or extend hours at profitable ones.
Every minute at a bad stop is a minute not spent at a good one. Every menu item that doesn't sell is taking space from one that could.
The compound effect of focus
When you align recipes, portions, and menus with stop-level reality, everything gets easier. Prep becomes predictable. Inventory turns faster. Your team knows exactly what to do at each location. Customers get better service because you're not spread thin trying to execute a 15-item menu everywhere.
A typical food truck doing $400k annually might show $40-50k in profit. That same truck, optimized by stop and menu, can realistically hit $75-90k on similar revenue. The difference comes from eliminating unprofitable stops (saving 15-20% of operating time), reducing food waste (cutting costs 4-5%), faster service from simplified menus (20-30% more transactions at high-volume stops), and better inventory turns with less working capital tied up.
This isn't about cutting corners or reducing quality. It's about being deliberate with your time, inventory, and menu. Every food truck has limited capacity — the ones that last are the ones that protect it.
Building your profit optimization rhythm
This isn't a one-time exercise. Markets change, seasons shift, competition moves in. Build a monthly rhythm:
Week 1: Review last month's stop-level performance.
Week 2: Test one menu change at your experimental stop.
Week 3: Analyze results and decide on wider rollout.
Week 4: Update your workbook and plan next month's tests.
Keep the workbook current. Every new stop gets analyzed before you commit. Every menu addition gets tested at one location first. Every operational change gets measured in contribution margin impact.
The food truck business is too competitive for gut decisions. When you know your numbers down to the penny and the portion, you can make changes that actually improve profits — not just shuffle problems from one stop to the next.
The food truck business is too competitive for gut decisions. When you know your numbers down to the penny and the portion, you can make changes that actually improve profits — not just shuffle problems from one stop to the next.
Ready to drive your food truck business forward?
Join 2,000+ food truck operators relying on Grubzly to boost efficiency, increase sales, and delight customers.