


Most food truck operators handle assets the same way: run it until it dies, then panic-buy a replacement. That works fine until your griddle quits during a Saturday lunch push, or your transmission goes out on the highway between a commissary and a catering gig you already took a deposit on.
The truck, the generator, the fryers, the refrigeration, the POS hardware — these aren't just costs. They're a portfolio of assets, each on its own clock, each with a point where keeping it costs more than replacing it. The problem is that clock is invisible until you build a system to see it. Operators who don't build that system almost always overpay in one of two ways: they replace too early and drain cash they didn't need to spend, or they replace too late and eat the downtime, the emergency premium, and the lost bookings.
This is a playbook for reading the whole food truck asset lifecycle as a system — replacement triggers, a maintenance-to-replace matrix, lease-vs-buy math you can actually run, depreciation and resale timing, and worked scenarios showing what a wrong call does to your weekly cashflow.
Why "run it till it dies" quietly wrecks small fleets
The single-truck operator can sometimes get away with reactive thinking because there's only one point of failure and they're standing right next to it. The moment you add a second truck — or even a second generator you swap between events — the math changes.
The pattern that keeps showing up: a truck with three or four aging major assets doesn't fail on a predictable schedule. It fails in clusters. The compressor and the water heater both start struggling in the same summer because they were installed during the same build-out. Now you're not making one repair decision, you're making three under pressure with a service risk hanging over every stop.
At scale, this creates a cashflow whiplash you can feel. One month is clean. The next has $2,800 in "surprise" repairs plus a lost catering deposit because the truck was down. If you don't spread these decisions across a lifecycle plan, your weekly cashflow model turns into a series of shocks instead of something you can plan staffing and sourcing around.
The core insight: replacement is not an event. It's a rolling decision you should be re-evaluating every quarter for every major asset. The goal isn't to predict the exact failure date — nobody can. The goal is to know which assets are close enough to the edge that a single bad repair should tip you into replacing instead of fixing.
The maintenance-to-replace matrix
The most useful tool here isn't a spreadsheet full of depreciation curves. It's a simple decision matrix that tells you, for any given asset, whether the next repair should be approved or should trigger replacement planning.
Stop losing sales to poor planning.
Grubzly helps you plan routes, track inventory, and maximize daily sales effortlessly.
- Real-time route optimization
- Inventory tracking & alerts
- Mobile sales & reporting
No credit card required
-
Age vs expected service life — how far into its usable life it is
-
Repair frequency — how many times you've touched it in the last 12 months
-
Cost of last repair as % of replacement cost — the "50% rule" flag
-
Service risk — what happens to revenue if it fails mid-shift
Here's the matrix in practice:
| Asset | Expected life | Age now | Repairs (12mo) | Last repair vs replace cost | Service risk | Call |
|---|---|---|---|---|---|---|
| Truck engine/drivetrain | 7–10 yrs | 8 yrs | 3 | 38% | High (whole day lost) | Replace-plan |
| Generator (primary) | 4–6 yrs | 5 yrs | 4 | 55% | High (kills all cooking) | Replace now |
| Refrigeration unit | 6–8 yrs | 3 yrs | 1 | 12% | High (spoilage + closure) | Keep + monitor |
| Flat-top griddle | 8–12 yrs | 6 yrs | 0 | — | Medium | Keep |
| Fryer | 5–7 yrs | 6 yrs | 2 | 30% | Medium | Monitor |
| POS hardware | 3–5 yrs | 4 yrs | 2 | 45% | Medium (lane slowdown) | Replace-plan |
The rule that does the heaviest lifting: when a single repair costs more than 50% of replacement and the asset is past 60% of its expected life, you stop repairing. That combination is the tell. One expensive repair on a young asset is bad luck. One expensive repair on an old asset is the asset telling you it's done.
The generator row above is the classic trap. Four repairs in a year, and the last one hit 55% of replacement cost. Operators keep sinking money into it because each individual repair feels smaller than buying new. Add up four repairs plus the risk of it dying at an event, and you've paid for most of a new unit while carrying all the downside.
Lease vs buy: run the actual numbers, not the vibe
The lease-vs-buy conversation usually gets lost in tax talk. For most small fleets the real question is simpler: which structure protects your weekly cash while giving you the flexibility you need for how fast you're changing?
A realistic generator comparison. Say a commercial-grade unit costs about $9,500 to buy outright, or you can lease it at roughly $260/month over 48 months with a $1 buyout.
Buy:
-
Upfront
$9,500 (or financed — a big cash hit either way)
-
You own resale value at end (maybe $2,000–$2,800 after 5 years)
-
You eat all repairs after warranty
-
Net cost over 5 years
roughly $9,500 + repairs − resale ≈ $9,000–$10,500
Lease:
-
Upfront
near zero
-
$260 × 48 = $12,480 + $1 buyout
-
Maintenance sometimes bundled depending on terms
-
Net cost over 5 years
roughly $12,500, but spread evenly
On paper buying wins by $2k–$3k. But what the raw total misses is this: the lease turns a $9,500 cash shock into a $260 line item you can plan around. If your reserve is thin and one bad month could stall your sourcing or payroll, that smoothing is worth real money — because a cash crunch that forces you to skip a produce order costs more than $3k in downstream damage.
When buying actually makes sense: stable operations, healthy reserves, assets you'll run to the end of their life, and equipment that isn't changing fast (griddles, fryers, prep tables).
When leasing makes sense: rapid growth where you're still figuring out your setup, thin cash reserves, or tech that ages fast (POS hardware, some refrigeration with efficiency gains). Also when you genuinely value swapping to newer equipment over ownership.
Who should not lease: an operator with strong cash who's going to hold the asset for its full life anyway. You're just paying a financing premium for smoothing you don't need.
Depreciation and resale timing — the part everyone gets wrong
The mistake here isn't ignoring depreciation. It's confusing tax depreciation with actual resale value, then holding assets past the window where they still have market value.
-
Identify the resale cliff. For a truck, that's often around year 6–7, where a running truck with clean maintenance records still commands a real price but drops sharply after.
-
Sell before the second major repair on an aging asset. Once you've done one big repair, the market discounts the asset anyway, and you're now more likely to need another.
-
Keep maintenance records that a buyer trusts. A documented service history can add 10–15% to resale on a truck versus one with no records. Your preventative maintenance discipline pays off twice — once in uptime and again at sale.
-
Don't wait for the "perfect" buyer. Every month you hold a depreciating asset past its cliff costs more than the price difference between offers.
A quick worked example. Say you bought a truck for $58k. At year 5 with clean records it might resell for $30k–$34k. Hold it two more years, put a $4k transmission into it in year 6, and by year 7 you're looking at $20k–$24k after the repair. That's roughly a $12k swing in equity for waiting — and you took on all the year-6 breakdown risk in between.
Worked scenario: the cashflow impact of one wrong call
Business: two-truck operation, mostly weekday lunch stops plus weekend events. Primary generator is 5 years old, four repairs in the past year.
The decision: the mechanic quotes $1,400 to fix a recurring generator fault. Replacement is a $9,500 unit. Individually, the repair looks obviously cheaper, so the operator approves it — for the third time this year.
What happened: the repair held for six weeks, then the generator died during setup at a Saturday festival. The truck couldn't cook. They refunded the event coordinator, ate the $600 booking, sent staff home mid-shift (still owed part of guaranteed pay), and paid an emergency premium of about $2,100 for a rushed replacement two days later.
-
The $1,400 repair (gone)
-
$600 lost booking
-
~$180 in staff pay for a shift that produced nothing
-
$2,100 emergency replacement premium over a planned purchase
-
Reputation hit with a coordinator who books multiple events a year
Versus the replace-planned path: buy the $9,500 unit on a planned schedule, keep the old one as a backup, zero lost bookings. The "expensive" decision was thousands of dollars cheaper once you counted service risk.
The weekly cashflow difference is the real lesson. The reactive path dropped roughly a $4,300 hole into a single week — exactly the kind of shock that forces operators to skip a produce order or delay payroll. The planned path would have been a scheduled line item they saw coming a quarter out.
This is also why maintenance and replacement planning can't live in separate heads. If the person approving repairs doesn't see the repair history and the service-risk score at the same time, they'll approve the small number every time. Tying your preventative maintenance schedule directly to your replacement triggers is what stops the "third $1,400 repair" from ever getting approved.
Decision thresholds worth writing down
Every operator should have a small set of hard triggers so these calls aren't made emotionally at 6am with a dead generator. Here's a starting set — adjust the percentages to your margins:
-
The 50% rule any single repair over 50% of replacement cost on an asset past 60% of its life → replace, don't fix.
-
The three-strike rule three or more repairs on the same asset in 12 months → move it to replace-planning regardless of individual repair cost.
-
The high-service-risk override for any asset where failure kills a whole shift (generator, refrigeration, drivetrain), lower your repair-cost threshold to 35% because the downside is so much larger.
-
The resale cliff trigger when an asset approaches its known resale cliff, decide to sell before the next major repair, not after.
-
The reserve floor if a cash purchase would drop your operating reserve below two weeks of expenses, lease or finance instead — smoothing is cheaper than a cash crunch.
Write these down and share them with whoever approves spending. The whole point is to make the right call boring and automatic instead of a judgment call under stress.
How this scales from one truck to a fleet
On one truck, you can hold this in your head. On three or four trucks with a shared generator or two, you're now tracking a dozen-plus major assets, each on its own clock, with repair histories scattered across text messages and mechanic invoices.
This is where growing operators get caught. The lifecycle system that worked as a mental note stops working the moment nobody can answer "how many times have we fixed generator #2 this year?" without digging through a shoebox of receipts. Repairs get approved in isolation. Assets blow past their resale cliffs because nobody was watching the age column. Cash shocks stack up.
The fix isn't complicated, but it has to be centralized. Every major asset needs a record with purchase date, expected life, running repair log, last repair cost vs replacement, and its service-risk tier. When a repair quote comes in, the person approving it should see that whole picture in ten seconds — not just the number on the invoice. This is the same discipline that keeps operations from breaking down as you scale from one truck to a fleet: systems that lived in one person's head have to become shared records everyone works from.
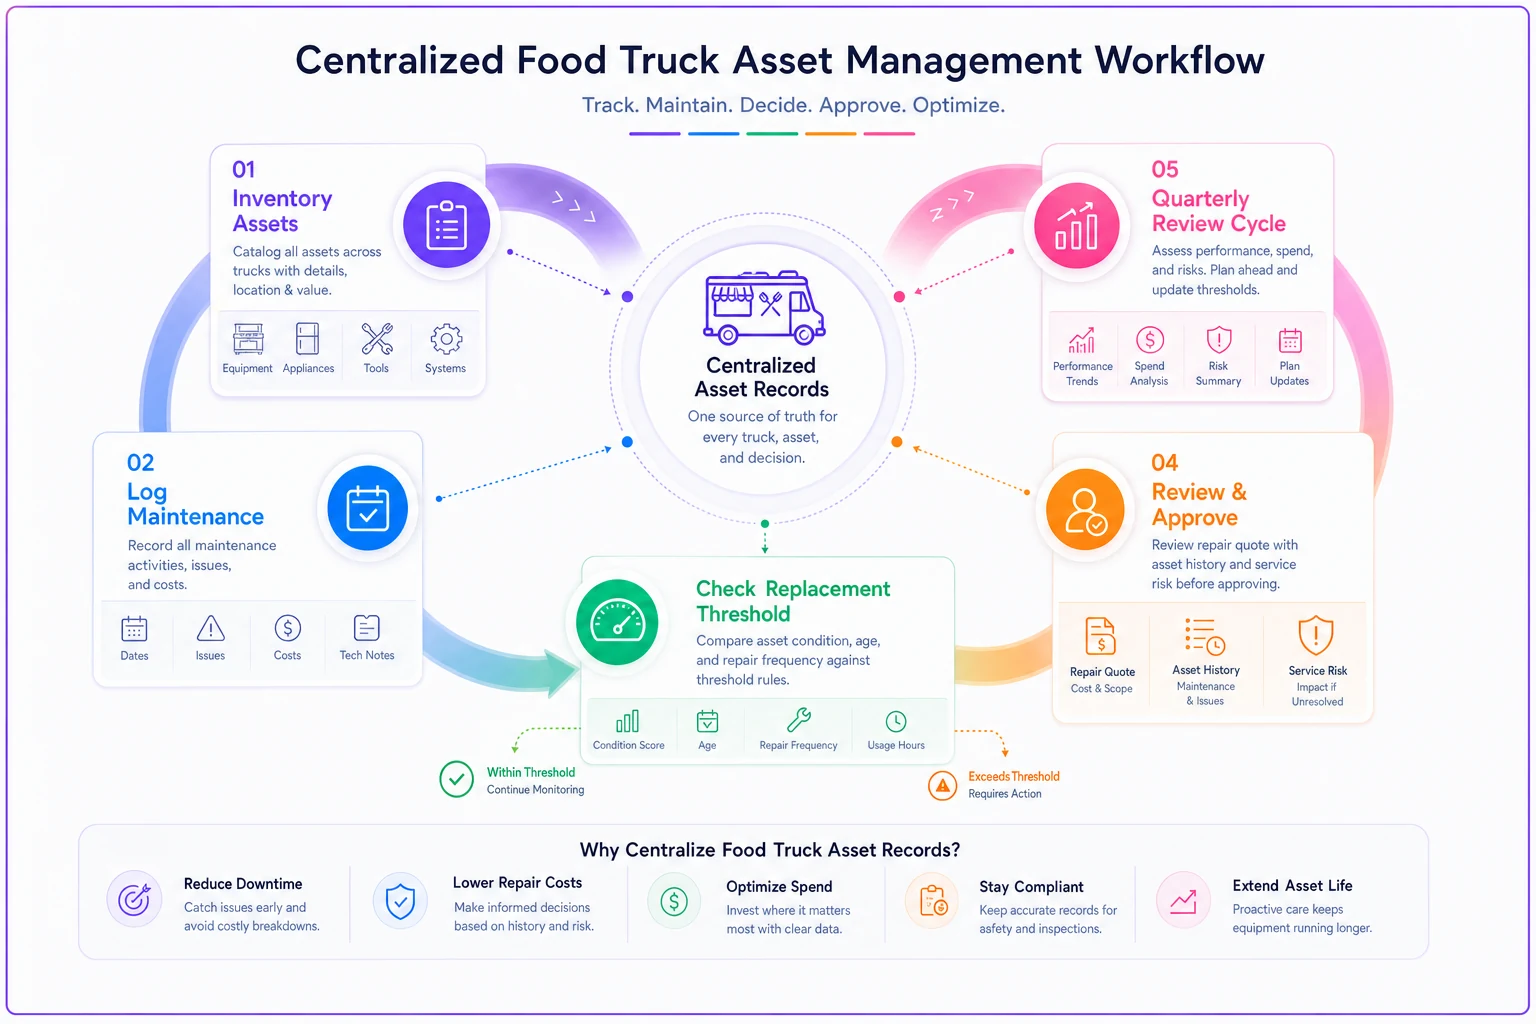
Operational platforms that track assets, log maintenance against each unit, and flag when an asset crosses your replacement thresholds turn this from a memory exercise into something the system watches for you. The quiet value isn't that software makes the decision — it's that it makes sure the decision gets made with the full history in front of you instead of just the latest repair bill.
Sample worksheet you can build this week
You don't need software to start. A single sheet per asset does the job:
-
Asset name & ID
-
Purchase date & cost
-
Expected service life (years)
-
Current age & % of life used
-
Repair log date, description, cost each time
-
Repairs in last 12 months (count)
-
Last repair cost as % of replacement
-
Service-risk tier high / medium / low
-
Estimated current resale value
-
Resale cliff date (best-guess)
-
Current call keep / monitor / replace-plan / replace-now
Review the whole set every quarter. Ten minutes per asset, four times a year, and you'll never again be blindsided by a replacement you could have seen coming two quarters out.
The takeaway
Assets don't fail randomly — they fail in patterns you can read if you're keeping score. The operators who stay ahead aren't the ones with the newest trucks. They're the ones who treat every major piece of equipment as a rolling decision, know their thresholds cold, and time replacements and resales while the asset still has value — before it takes a shift down with it.
Get the maintenance history, the service risk, and the replacement math into one place, and the hard calls stop being hard. You'll spend less over the life of every asset, protect your weekly cash from shocks, and stop letting your generator make your business decisions for you.
Assets don't fail randomly — they fail in patterns you can read if you're keeping score. The operators who stay ahead aren't the ones with the newest trucks. They're the ones who treat every major piece of equipment as a rolling decision, know their thresholds cold, and time replacements and resales while the asset still has value — before it takes a shift down with it.
Get the maintenance history, the service risk, and the replacement math into one place, and the hard calls stop being hard. You'll spend less over the life of every asset, protect your weekly cash from shocks, and stop letting your generator make your business decisions for you.
Ready to drive your food truck business forward?
Join 2,000+ food truck operators relying on Grubzly to boost efficiency, increase sales, and delight customers.