


Most trucks I've looked at don't have a cash problem in the way owners think they do. They have a timing problem. The truck can be profitable on paper for the month and still get caught short on a Tuesday because a big catering deposit hasn't cleared, the commissary invoice hit early, and last weekend's farmers market underperformed by 30%. The money exists somewhere in the cycle — it's just not in the account when the bill lands.
That mismatch is exactly why a monthly view is close to useless for a mobile kitchen. Monthly numbers smooth over the thing that actually kills trucks: the swing between a $2,800 corporate lunch event and a $340 rainy-day street stop, both sitting inside the same seven days. You need a model that runs on the same cadence your business actually operates on — weekly — with each event carrying its own tiny P&L so you can see which stops are quietly funding the rest.
This is the pillar piece that ties a lot of the operational stuff together. Less accounting theory, more about building a repeatable weekly rhythm you can actually run in an hour, plus reserve rules that stop you from ever being surprised by a Tuesday again.
Why the monthly P&L lies to food trucks
A restaurant with a fixed address has relatively stable weekly revenue. A truck doesn't. Your revenue is a bag of dice — different stop types, different weather sensitivity, different payment timing — and the monthly average hides all of it.
The pattern that shows up constantly: an operator looks at the month, sees revenue at $42k, costs at $34k, "profit" $8k, and feels fine. But inside that month, week two was quietly awful because a recurring corporate stop went on summer break. The operator only noticed three weeks later when the numbers were already baked — by which point two decisions had already been made on bad information. Over-ordered produce, full crew kept on schedule.
The monthly close is still worth doing properly; it's where you catch things that slip through the daily and weekly loops. If your month-end is already a mess, that's a separate problem — there's a whole offline-first close playbook worth reading that covers it. But the monthly view is a rear-view mirror. The weekly model is your windshield.
The core insight: on a truck, variability isn't noise you average out. Variability is the operating condition. Your model has to treat it as the main event, not an exception.
The two-layer structure: event P&L feeds the weekly sheet
The model has two layers that plug into each other.
Stop losing sales to poor planning.
Grubzly helps you plan routes, track inventory, and maximize daily sales effortlessly.
- Real-time route optimization
- Inventory tracking & alerts
- Mobile sales & reporting
No credit card required
The bottom layer is the event-level P&L — one small worksheet per stop or booking. Not a formal statement, just the six or seven lines that tell you whether a specific stop made money after everything you spent to be there.
The top layer is the weekly cashflow sheet — a rolling view of money in and money out, dated to when cash actually moves, not when the sale happened. This is the layer that answers the only question that matters on a Monday morning: do I have enough to get through the week without stress?
The mistake most people make is skipping the bottom layer. They track total weekly revenue and total weekly costs, which tells you the week was good or bad but never why. Without event-level numbers you can't tell that your Thursday brewery stop has been losing $60 every single week for two months while your Saturday market carries the whole operation.
What actually goes on the event P&L
-
Gross sales (from POS, net of refunds)
-
COGS for that stop — food actually consumed, not what you loaded
-
Direct labor — hours × rate for that stop, including prep time allocated to it
-
Fuel + drive time — round trip, and yes, count the driver's time
-
Stop-specific fees — commissary allocation, event fee, permit-per-day, power/generator fuel
-
Payment timing — cash now, card in 1–2 days, invoice in 15–30 days
That last line is the one everyone forgets, and it's the bridge to the cashflow layer. A $2,800 catering event with a 30-day invoice is revenue today but not cash today. If you don't tag it that way, your weekly sheet will lie to you exactly the way the monthly one does.
If you want to go deeper on how COGS and portioning drive the per-stop number, the per-stop P&L and recipe costing breakdown covers the food-cost side in more detail than I'll get into here.
A worked example: three common stop types in one week
Realistic numbers for a mid-size truck running a typical mixed week. The point is the shape of the numbers, not the precision.
Below is a simple worked example showing common stop types and when cash actually lands for each.
| Stop | Gross sales | COGS | Labor | Fuel/drive | Fees/power | Contribution | When cash lands |
|---|---|---|---|---|---|---|---|
| Weekday office lunch | $1,150 | $360 | $260 | $45 | $30 | ~$455 | Card, 1–2 days |
| Brewery evening stop | $680 | $230 | $240 | $55 | $90 (venue %) | ~$65 | Card + cash, ~2 days |
| Saturday farmers market | $2,400 | $720 | $480 | $40 | $120 | ~$1,040 | Mostly cash, same day |
| Corporate catering (Fri) | $2,900 | $780 | $420 | $60 | $0 | ~$1,640 | Invoice, net-30 |
Total contribution for the week: roughly $3,200. Feels like a strong week. But look at the timing column. Of that $3,200, the corporate catering's ~$1,640 doesn't arrive for a month. Same-week cash contribution is closer to $1,560 once you strip out the invoiced booking.
Two things jump out when you lay it out like this.
First, the brewery stop is nearly break-even. At ~$65 contribution after the venue's cut, one slow week or one extra prep hour flips it negative. This is the stop that "feels busy" but earns almost nothing. Most operators keep running it for months because it looks alive on the schedule.
Second, the week is cash-heavy on Saturday and cash-thin on the days the bills are actually due. If your commissary invoice and payroll both land Wednesday, you're funding them off the office lunch and the brewery — the two weakest cash days — while your best money is either already spent (Saturday) or still 30 days out (catering).
That's the whole problem in one table. Not "am I profitable" but "is the cash in the right place at the right time."
Reserve sizing: how much cushion, and why it's not one number
Everyone says keep a reserve. Almost nobody explains how to size it for a business where weekly revenue can swing 40% on weather alone. A flat "keep one month of expenses" rule is lazy for a truck, because it ignores that your variability is driven by your stop mix, not your average.
Your reserve needs to cover two separate things: the gap between a bad week and your fixed obligations, and the float you're carrying in unpaid invoices. Those are different risks and they need different buckets.
Rule-of-thumb reserve sizing by stop mix
-
If your revenue is mostly same-day cash (markets, street, festivals) timing risk is low but weather risk is high. Size your reserve to cover 2–3 weak weeks of fixed costs — the danger is a run of bad weather, not slow payments.
-
If you're heavy on invoiced catering (net-15 to net-30) your profit looks fine but your cash is always a month behind. Size a reserve equal to your largest single month of outstanding invoices, because that's the hole you're standing in if two clients pay late at once.
-
If you're running a balanced mix (like the example above) hold roughly 3–4 weeks of fixed costs, plus a separate line tracking outstanding invoiced revenue so you never confuse "owed" with "available."
A concrete way to set the fixed-cost number: add up everything that hits regardless of sales — commissary rent, truck payment, insurance, base payroll, permits. For a busy single truck that's often somewhere in the $4,500–$5,500 range weekly. A balanced operator should be sitting on roughly $15k–$20k of genuine reserve before feeling comfortable absorbing a slow month or a big equipment repair.
One pattern worth flagging: trucks that grow fast almost always under-reserve, because growth feels like safety. More bookings, bigger events, busier calendar. But bigger catering means bigger invoices means more cash tied up in net-30 float — so the faster you grow on the catering side, the more reserve you actually need. That's counterintuitive, and it catches good operators.
Track outstanding invoices weekly and treat the largest single month's float as a separate reserve line when sizing cushion.
That's counterintuitive, and it catches good operators.
Decision thresholds: turning the model into weekly moves
A model that just describes the week is a diary. A model that tells you what to do is a system. The last piece is a set of thresholds — pre-decided triggers — so you're not making emotional calls on a Sunday night.
-
If a stop's contribution drops below ~10% of its gross for three weeks running, put it on notice. Renegotiate the venue cut, shorten the shift, or cut it. The brewery stop above is the textbook candidate.
-
If projected end-of-week cash falls below one week of fixed costs, trigger a pull-forward: chase outstanding invoices, delay a non-urgent supplier order, or move a produce buy to just-in-time.
-
If outstanding invoiced revenue exceeds your reserve, stop taking net-30 catering without a deposit. You've effectively become a bank for your clients, and that's how profitable trucks go broke.
-
If a single event type is more than ~40% of weekly revenue, treat that as concentration risk and start diversifying stops — one lost contract shouldn't take out your month.
These thresholds only work because the event P&L feeds real numbers into them. Guessing doesn't trigger anything.
The weekly workflow: running the whole thing in under an hour
Here's how the two layers actually run together across a week.
Sunday evening (20 minutes): Pull the week's confirmed stops into the top of the cashflow sheet. For each one, drop in the expected event contribution and — critically — the date cash actually lands. Layer in the week's known outflows: payroll date, commissary invoice, fuel, any loan or insurance draft. Now you can see every day where outflow beats inflow before it happens.
During the week (2 minutes per stop): After each stop closes, update the event P&L with actuals from the POS. This is where your daily reconciliation habit matters — if end-of-day numbers are sloppy, the whole week's model is built on sand. The daily cashflow and POS reconciliation routine is basically the feeder process for this entire model, especially when you're running offline and syncing later.
Friday or end of week (15 minutes): Compare projected vs actual for each stop. Flag anything that missed by more than 15%. Check your threshold triggers. Note which stops are drifting toward break-even. Roll unpaid invoices forward into next week's expected-cash column.
Here's a quick visual of that weekly loop.
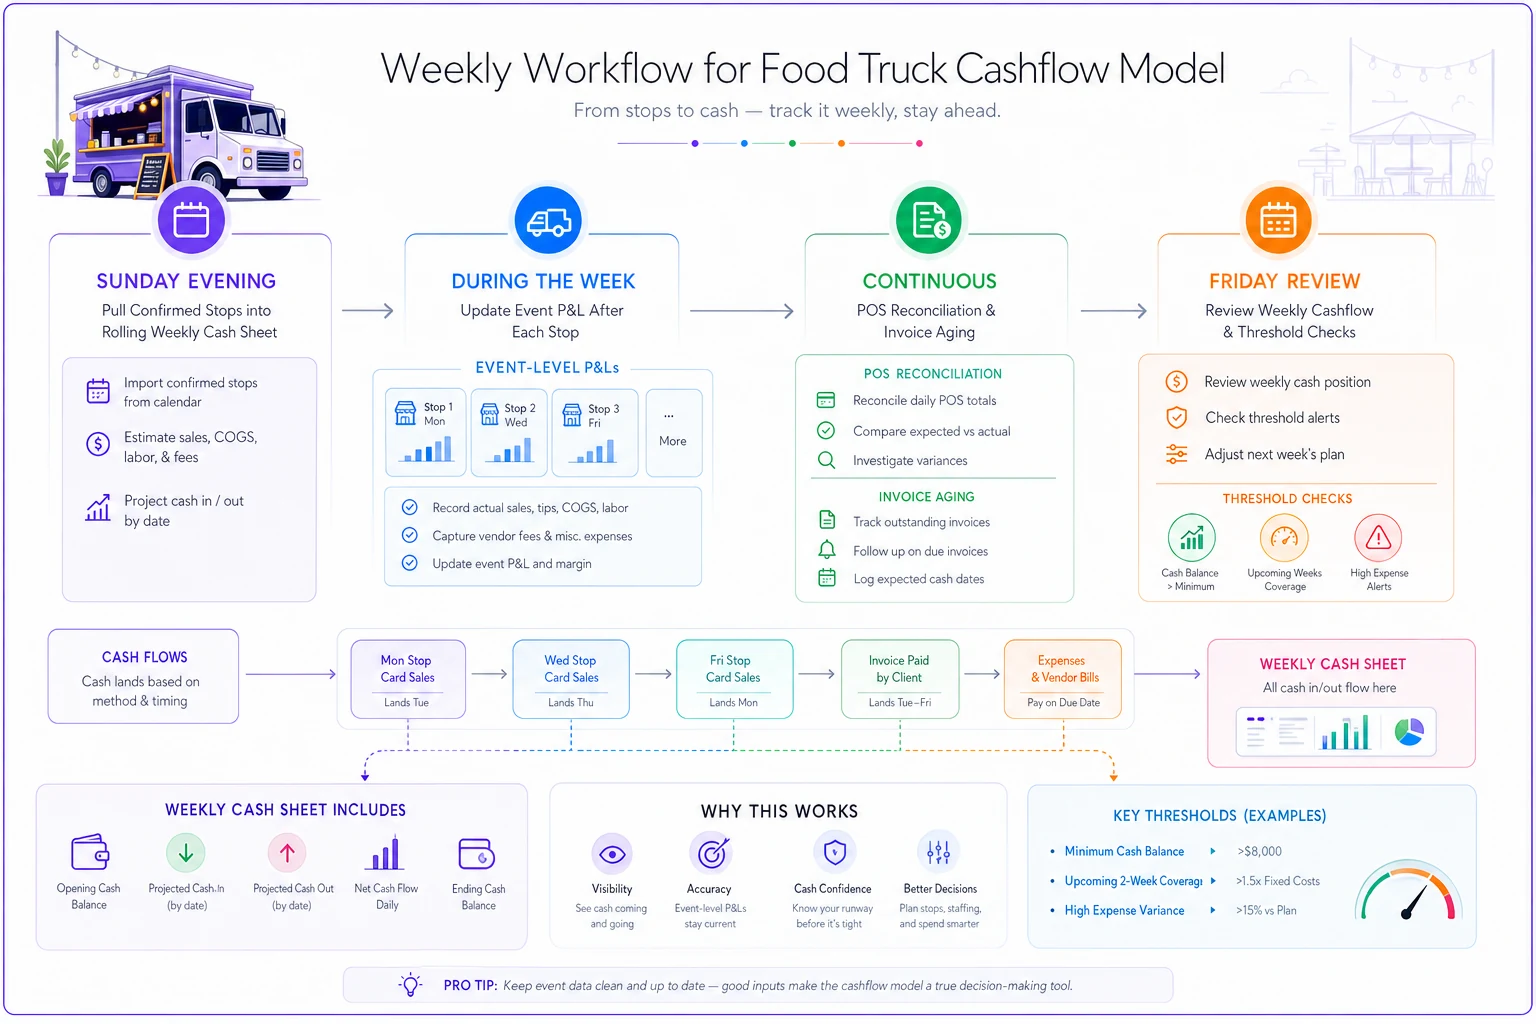
That's the whole loop. Twenty minutes, two minutes a stop, fifteen minutes to close. The value isn't the spreadsheet — it's that a bad Tuesday shows up on the radar Sunday, not when the bill lands.
Where a spreadsheet stops being enough
A workbook is fine when you're running one truck and can hold the whole week in your head. The manual model works right up until you're managing two trucks, five stop types, and a catering calendar with invoices sitting at different net terms. Then the reconciliation between event actuals and the weekly cash view starts eating your evenings, and stale numbers creep in.
That's usually when operators move the same logic into operational software that pulls POS actuals automatically and tags cash-landing dates — so the event P&L populates itself and the threshold triggers fire without you rebuilding the sheet every Sunday. The model doesn't change. What changes is that the data entry and invoice-aging math stop being manual. You're still making the calls; the platform just keeps the numbers current while you're actually running service.
That said, hold off on that until the manual version is genuinely painful. Build the discipline in the spreadsheet first. If you can't run the weekly loop by hand, automating it just gives you wrong answers faster.
A real scenario: the truck that was "profitable" and always broke
A two-person taco truck — mostly weekday office parks, weekend markets, occasional catering. On paper they cleared somewhere around $6k–$7k a month. In reality the owner was moving money between personal and business accounts almost every week to cover the commissary invoice.
When we mapped it to an event P&L, two things were obvious inside a single week. One weekday office stop had quietly gone soft — the building's tenants had thinned out — and it was running under 8% contribution while eating an hour of drive time each way. And their catering, which they were genuinely proud of, was all net-30. So roughly $3k–$4k of their "profit" was permanently 30 days out of reach.
Nothing dramatic changed. They dropped the dead office stop, added a deposit requirement on catering, and started sizing a reserve against outstanding invoices instead of a flat monthly number. Within about two months the mid-week cash scramble was gone. Same revenue, roughly. The business was always profitable — it just never knew where its cash actually was.
The workbook
The downloadable weekly cashflow workbook that goes with this includes the event P&L worksheet (one tab per stop type), the rolling weekly cash view with cash-landing dates, the reserve-sizing calculator keyed to your stop mix, and the worked examples above so you can see the formulas rather than just trust them.
Copy it, plug in your real stops, and run one full week before you change anything.
The point of all this isn't tighter accounting. It's that a mobile kitchen lives and dies on timing, and timing is the one thing a monthly view can never show you.
Run the week on the week's own cadence, let each stop carry its own tiny P&L, and set your thresholds before you're tired and it's already Sunday night. That's the difference between a truck that's profitable and a truck that's profitable and never short.
Ready to drive your food truck business forward?
Join 2,000+ food truck operators relying on Grubzly to boost efficiency, increase sales, and delight customers.