

Most food truck owners don't have a data problem. They have a definition problem.
You've got sales in Square, cash counts in a notebook, ingredient costs in a supplier email, and route notes on your phone. Every one of those sources thinks it knows what "a sale" is. None of them agree. So when you sit down on Monday to decide whether to keep working the office-park lunch stop or drop it, you're reconciling four versions of reality in your head — and quietly guessing.
That's the real cost of weak small-data governance for a food truck. It's not that you lack numbers. It's that the numbers can't be trusted enough to bet money on. And when you're running two or three trucks across a handful of stops, one bad definition quietly poisons every decision downstream.
This is a playbook for fixing that without buying an enterprise data stack. Low-tech. CSV and paper where it makes sense. The goal is simple: garbage doesn't get into the decision.
Why the numbers lie (even when nobody's lying)
Here's the pattern that shows up in almost every small fleet: nobody is faking data, but everyone is capturing it slightly differently.
One truck logs a catering order as a single $600 sale. Another splits the same kind of order into 40 individual tickets because that's how the staff rang it up. Your POS counts a voided-then-reordered item as two transactions. Your cash drawer count includes the float some nights and not others. None of these are mistakes exactly — they're just undefined.
A typical example looks like this. You want to know your average ticket by stop. Stop A shows $14.20. Stop B shows $9.80. Looks like Stop A is your winner, so you shift more inventory there. But Stop A's number is inflated because it includes three catering pickups that happened to be scheduled at that location. Strip those out and Stop A is actually $8.90 — your worst performer per walk-up customer. You just moved product toward your weakest stop because "average ticket" meant two different things at two locations.
This is what people mean by garbage-in decisions. The math was fine. The definition underneath the math was rotten. And the more locations and people you add, the more definitions drift, because every new person captures data the way that makes sense to them in the moment.
Start with canonical definitions (this is the whole game)
Before you touch a template or a spreadsheet, write down what each metric means — one definition, agreed on, that every truck and every shift uses. There's exactly one official version of each number.
Stop losing sales to poor planning.
Grubzly helps you plan routes, track inventory, and maximize daily sales effortlessly.
- Real-time route optimization
- Inventory tracking & alerts
- Mobile sales & reporting
No credit card required
You don't need many. Ten to fifteen metrics cover almost everything a small fleet actually decides on. What matters is that each one is unambiguous enough that two different people would count it the same way.
Here's what a canonical definition sheet looks like in practice:
| Metric | Canonical definition | Explicitly excludes |
|---|---|---|
| Gross sales (stop) | All completed transactions rung at that stop's shift | Voids, catering, refunds |
| Walk-up tickets | Distinct completed orders from on-site customers | Catering, pre-orders, staff meals |
| Average ticket | Gross walk-up sales ÷ walk-up tickets | Anything catering-related |
| Catering revenue | Pre-arranged orders with a deposit or invoice | Regular walk-up sales |
| Food cost (stop) | Cost of goods actually loaded for that stop | Commissary prep waste, samples |
| Waste units | Portions discarded or unsold at end of shift | Comped/sampled items |
| Labor hours (stop) | Clock-in to clock-out for that location | Drive time (tracked separately) |
The excludes column is the part people skip, and it's the part that actually saves you. Ninety percent of definition drift happens because two people disagree about what doesn't count. Write the exclusions down explicitly and most of your reconciliation headaches disappear before they start.
One rule worth enforcing: catering and walk-up never live in the same metric without a flag. They behave completely differently and blending them wrecks nearly every per-stop decision. If you're already tracking a per-stop P&L, your canonical definitions need to match that structure exactly, or the two systems will fight each other.
Capture at the source — templates, not memory
Once definitions exist, the next failure point is capture. This is where most small fleets bleed data quality, because capture happens during the rush when nobody has time to be careful.
The fix isn't more software. It's a capture template so simple that a tired closing employee can fill it out correctly at 9pm without thinking. If a template requires judgment, it will be filled out inconsistently.
Your end-of-stop capture row should hold, at minimum:
-
Date and stop ID (a short fixed code, not a free-text location name)
-
Shift start / shift end times
-
Gross sales from POS (written down, not "we'll pull it later")
-
Cash counted (and whether float is included — a checkbox, not a note)
-
Walk-up ticket count
-
Catering orders (count + total, flagged separately)
-
Waste units by top 3 menu items
-
One free-text line
anything weird that happened
That last line matters more than it looks. "Generator died for 40 min" or "ran out of buns at 12:15" is the context that explains an ugly number later. Without it, next week you're staring at a bad stop with no idea whether it was a location problem or a one-off.
Two capture rules that prevent most garbage:
-
Stop IDs are fixed codes. "Wells Fargo plaza," "the bank one," and "downtown Tues" are the same stop written three ways, and your spreadsheet will treat them as three locations. Assign each stop a code like
DT-01and never deviate. -
Capture the raw number, not the interpretation. Write down what the POS says and what the drawer says. Don't reconcile them in your head at the truck. Reconciliation happens later, on purpose, with a clear head.
Make the "float included" field a checkbox column so it's quick to fill and unambiguous.
Two capture rules that prevent most garbage:
The nightly reconcile: ETL-lite for people who hate the word ETL
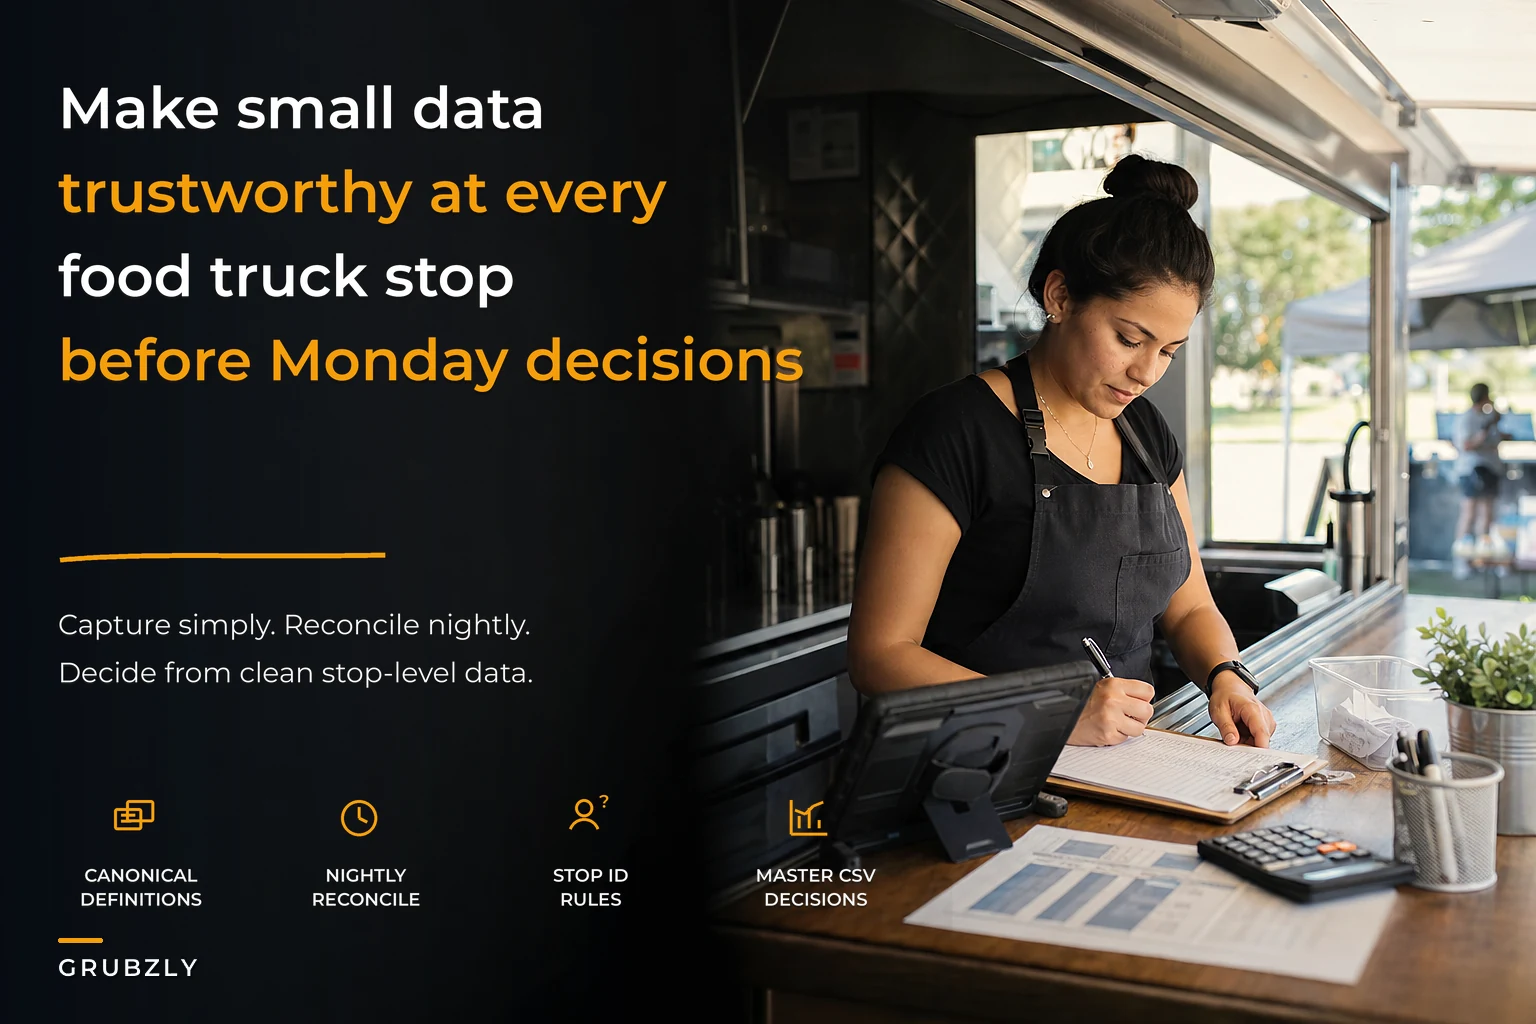
"ETL" — extract, transform, load — sounds like something that needs an engineer. For a small fleet it's a fifteen-minute nightly habit that turns messy capture rows into one clean file you can actually trust.
Here's the workflow, plain language.
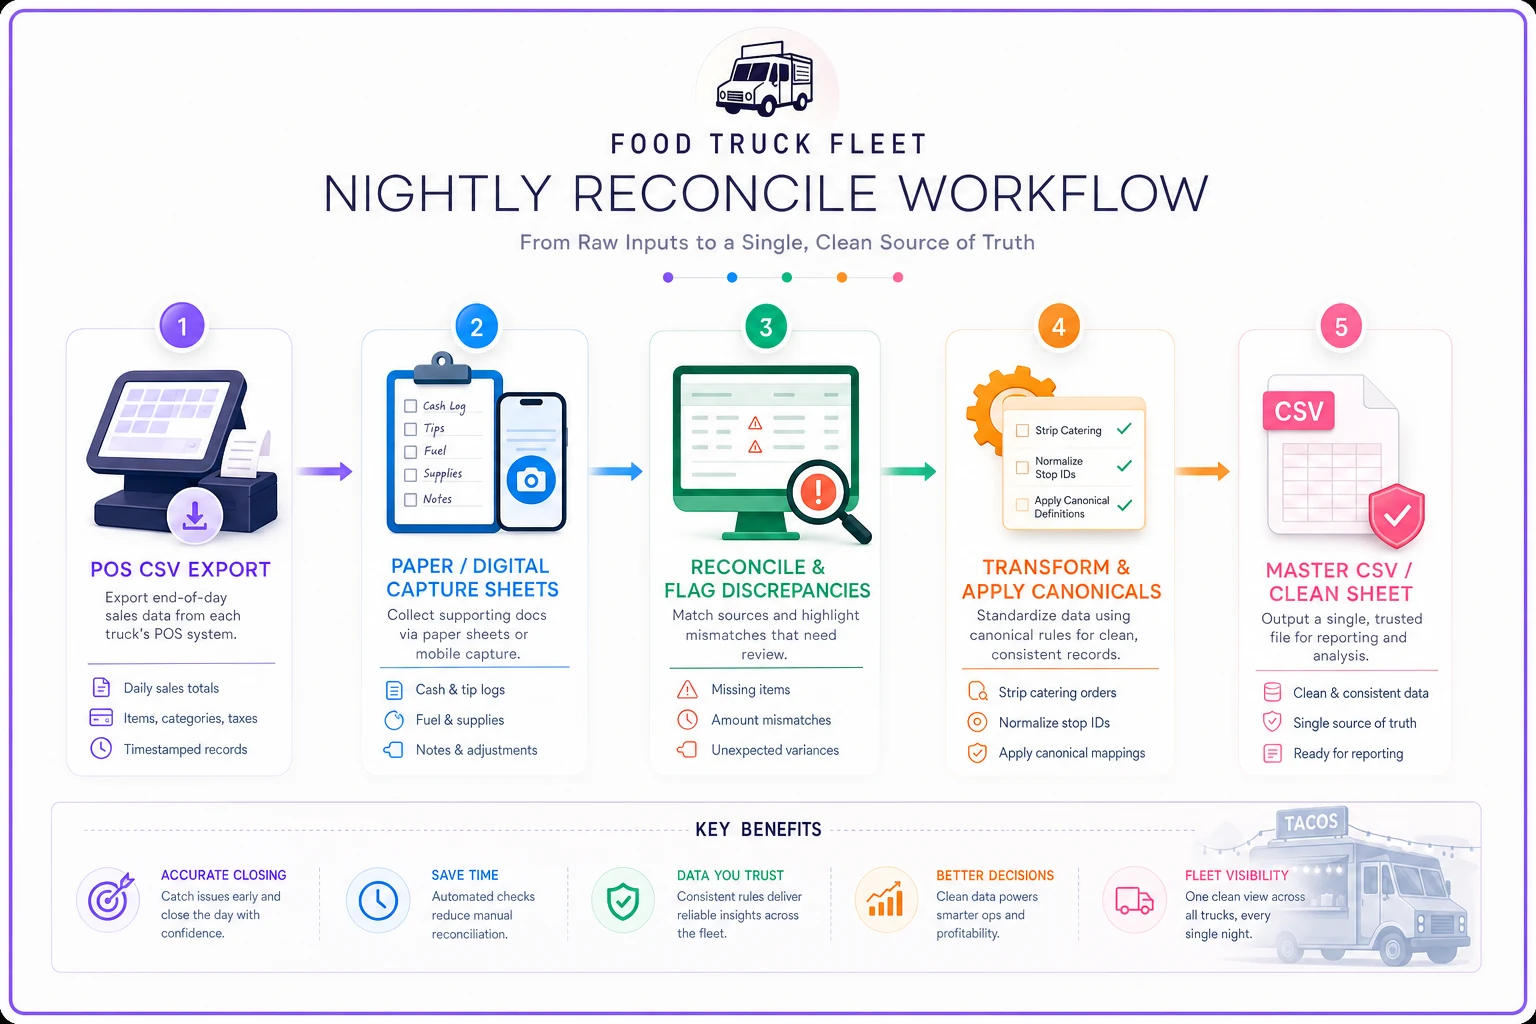
A simple visual like this helps new staff learn the habit faster and makes the nightly steps obvious.
Extract. Pull the day's POS export (CSV) and gather the paper or digital capture sheets from each truck. You now have two sources per stop: what the machine says and what the human counted.
Reconcile. For each stop, compare POS gross to your captured gross. If they match within a small tolerance — say a few dollars for rounding — good, move on. If they're off by more than that, flag it. Don't fix it silently. A flagged discrepancy is data too; it tells you which stop or which shift has a capture problem worth coaching.
Transform. Apply your canonical rules. Strip catering out of walk-up metrics. Recalculate average ticket the official way. Convert every location label to its fixed stop ID. Tag anything the free-text line flagged as a "context note" attached to that row.
Load. Append the cleaned rows to one master file — a single running CSV or sheet that is now the only source you make decisions from. Nobody decides off the raw POS export or off a truck's paper sheet ever again. Everything routes through the reconciled master.
The discipline that makes this work: the master file is sacred and the raw sources are disposable. Once a row is reconciled and loaded, that's the truth. If you find an error later, you correct it in the master and note why. This is how you avoid the classic small-fleet problem where three people quote three different revenue numbers for the same Tuesday.
A quick, honest note on tooling. You can absolutely run this in spreadsheets, and plenty of two-truck operations should. As you grow past a few trucks and a dozen stops, the nightly reconcile starts eating real time, and this is where AI-assisted operational software earns its place — not by making decisions for you, but by flagging discrepancies automatically, mapping messy location labels to your canonical stop IDs, and appending clean rows to the master without someone hand-typing at midnight. The judgment stays with you. The tedious matching and merging is exactly the kind of repetitive reconciliation that automation handles well, and offloading it means the nightly habit actually survives past week three.
Transform rules: the boring layer that saves you
Transform rules are just the "always do this to the raw data" logic. Writing them down once removes a whole category of week-to-week arguments.
A few that pull real weight for food trucks:
-
Catering flag propagation. Any row tagged catering is excluded from walk-up average ticket, walk-up throughput, and per-customer food cost — automatically, every time.
-
Void handling. A void followed by a re-ring counts as one sale, not two. Decide this once.
-
Float normalization. Cash counts always get the float subtracted before comparison. One rule, applied everywhere, ends the "wait, did this include the $200 float?" confusion.
-
Drive time separation. Labor tied to a stop is clock-in-to-clock-out at that location. Drive time is its own bucket. Blending them makes every stop look more expensive than it is and quietly biases you against your farther, sometimes more profitable, locations. If routing efficiency matters to you, keeping drive time cleanly separated is what lets you actually measure it.
The point isn't sophistication. It's removing the moment where someone has to decide in the moment how to handle an edge case. Every in-the-moment decision is a chance for inconsistency. Codify it once, and the edge cases stop being edge cases.
The one-page decision cadence
Clean data is worthless if it doesn't reach a decision. The last piece is a fixed weekly rhythm so the numbers actually change what you do.
-
Open the master file. Not the POS. Not a truck's notes. The reconciled master.
-
Scan the flags. Any discrepancy flags from the week? Those are coaching or capture problems, handle them first — bad capture this week is bad decisions next week.
-
Review per-stop performance using canonical metrics only. Walk-up average ticket, walk-up volume, food cost, waste, labor — by stop ID.
-
Read the context notes. An ugly stop with "generator died 40 min" is a different decision than an ugly stop with no explanation.
-
Make at most three decisions. Keep, drop, adjust. Move inventory. Change a stop's staffing. Kill a location. Small fleets that try to change ten things a week change nothing.
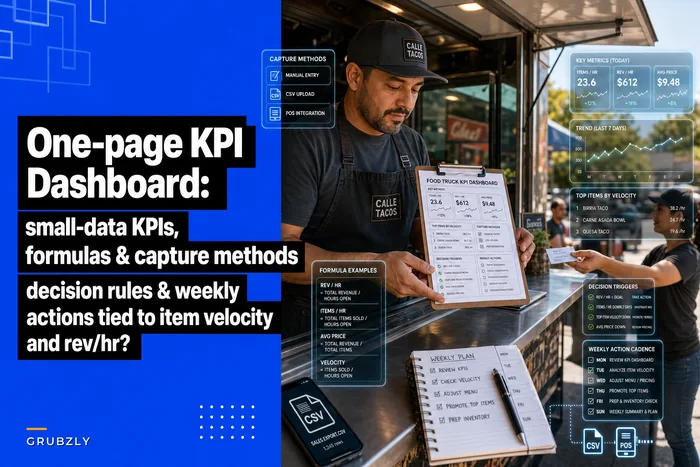
This cadence is where a clean one-page KPI dashboard pays off — the governance work upstream is what makes the dashboard numbers trustworthy enough to act on. A pretty dashboard built on undefined metrics is just a faster way to make the wrong call.
A worked example: from stop-level rows to a Monday decision
Say you run three trucks and you're deciding what to do about a downtown lunch stop, DT-02, that "feels slow."
Raw POS says DT-02 did about $2,100 over four Fridays — roughly $525 a shift. Middle of the pack. Nothing screams cut it.
Now you run it through governance. Two of those Fridays included catering pickups scheduled at that location — around $840 total. Those weren't walk-up business; they'd have happened anywhere. Strip them out per your transform rules and DT-02's actual walk-up revenue is closer to $1,260, or about $315 a shift.
Walk-up tickets across the four Fridays: roughly 95. That's an average walk-up ticket near $13.20 — actually fine. So the problem isn't ticket size, it's volume: about 24 walk-up customers per lunch shift, well below your other downtown stops.
The context notes add the last piece. Two of the free-text lines mention "hard to find, no signage visible from street." That reframes the whole decision. DT-02 isn't a bad location — it's an invisible one. The Monday decision isn't "drop it." It's "test A-frame signage on the corner for two weeks and re-measure walk-up volume."
Without governance, you'd have read $525 a shift, shrugged, and either kept a quietly failing stop or cut one that a $40 sign could have fixed. Same rows, completely different — and correct — decision. That's what clean definitions actually buy you.
When this playbook makes sense (and when it's overkill)
If you're running a single truck at one or two regular stops, honestly, most of this is more than you need. You can hold the reality of a one-truck operation in your head. Write down canonical definitions anyway — it takes twenty minutes and it'll matter later — but don't build a nightly reconcile ritual for a business you can eyeball.
Where this becomes non-negotiable:
-
Two or more trucks. The moment two people capture data, definitions drift. Governance is the only thing that keeps their numbers comparable.
-
Multiple stops with rotating menus or catering. Blended catering and walk-up data will mislead you every single week without transform rules.
-
You're about to make an inventory, staffing, or routing bet based on the numbers. If money's moving because of a metric, that metric needs to be clean first.
Who should not do this yet: anyone still fighting to get a POS export at all, or capturing zero data at the truck. Governance is the layer on top of capture. Fix capture first — get some consistent numbers flowing — then come back and make them trustworthy. Governance on top of no data is just paperwork.
The real point
Small-data governance for a food truck isn't about becoming a data company. It's about making sure the handful of numbers you actually decide on mean the same thing every week, on every truck, no matter who wrote them down.
The operators who scale cleanly aren't the ones with the fanciest dashboards. They're the ones whose Tuesday revenue number is the same whether you ask the owner, the closing employee, or the spreadsheet — because they defined it once, captured it the same way every time, and reconciled it before anyone made a decision on it. Everything downstream, from routing to inventory to which stops survive, gets sharper the moment the inputs are clean. If you're also thinking about how orders flow across channels, the same logic applies there — clean definitions have to exist before omnichannel ordering data is worth anything either. Start with the definitions. The rest follows.
Small-data governance for a food truck isn't about becoming a data company. It's about making sure the handful of numbers you actually decide on mean the same thing every week, on every truck, no matter who wrote them down.
Ready to drive your food truck business forward?
Join 2,000+ food truck operators relying on Grubzly to boost efficiency, increase sales, and delight customers.